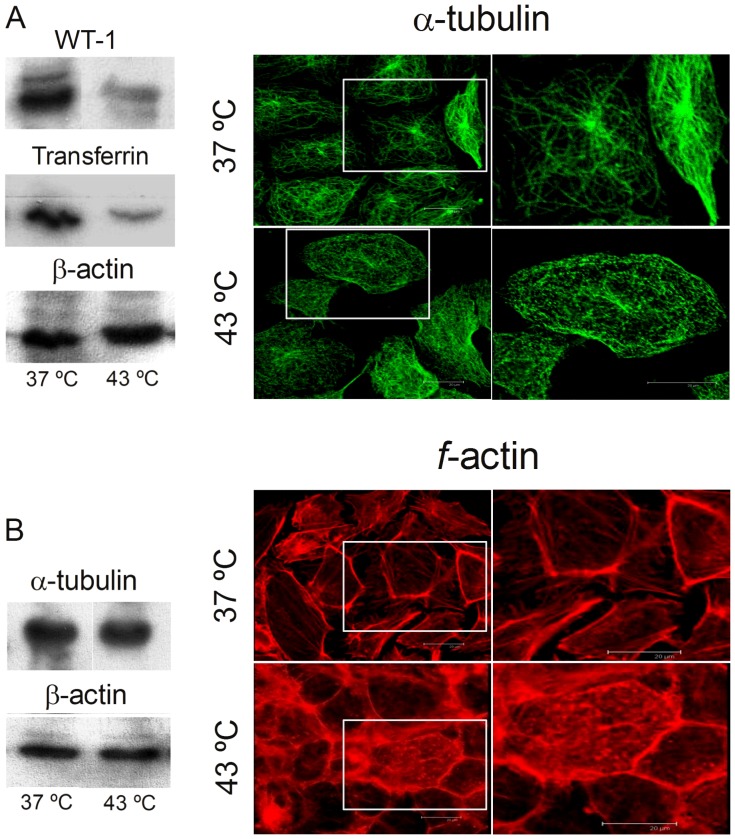
Figure 8. Effects of hyperthermia on specific functional and structural SC proteins.
The depicted proteins were obtained from cells cultured for 5 days at 37°C and from cells cultured similarly but exposed once a day for 15 min to 43°C. A) Intensities of the WT1 and transferrin bands, as normalized with respect to the intensity of β-actin. B) β-actin and α-tubulin levels, as normalized with respect to total cell protein. C) Effects of the repeated brief exposures to 43°C, on α-tubulin microtubules and f-actin networks, as observed by confocal microscopy. The areas indicated by the white rectangles are shown enlarged on the right panels.

