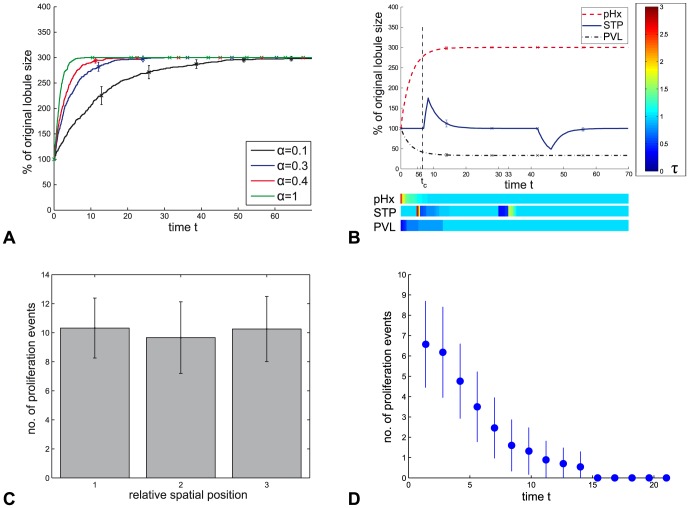
Figure 5. Simulation results of the HD model.
A Temporary progression of the lobule size in dependence of  , which is the sensitivity of the proliferation response to deviations from the normal shear stress value
  . B Temporary progression of the lobule size in the simulation with
  (red curve in A) in the scenarios (pHx), (STP) and (PVL) as given in Table 1. The shear stress strength is illustrated by a color-code for the different scenarios. The time point at which compensatory growth is 90% completed is marked with
  . C Spatial distribution of proliferation events for the scenario (pHx). For each time point, the hepatocyte layer is equally divided into three sections displayed on the horizontal axis. The proliferation events are recorded for each section over the entire simulation time and are depicted as number of proliferation events for different relative spatial positions. D The frequency of proliferation events for scenario (pHx) is depicted as number of proliferation events per time point.

