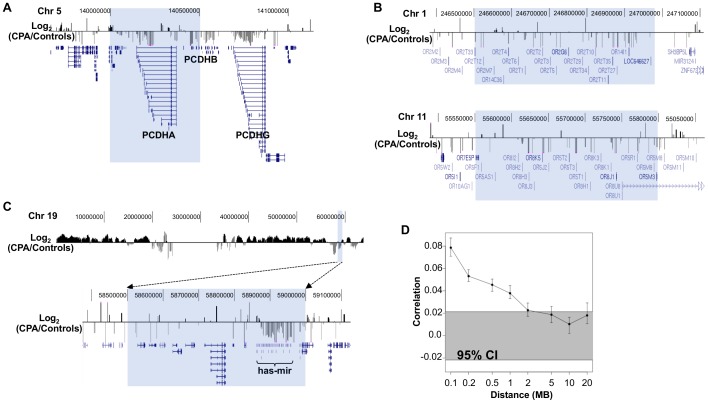
Figure 2. Megabase co-clustering of differential methylation between CPA (n = 8) and controls (n = 12).
A. Co-clustering of differential methylation among the protocadherins genes. Positive values (black bars) indicate increased methylation in CPA compared to controls and negative values (grey bars) indicate the opposite. Shaded in blue is a 500 Kb region containing protocadherins family A and B whose promoters are consistently less methylated in CPA than in controls (scale log2 fold differences: −0.2 to 0.2). B. Co-clustering of differentially methylated promoters with common function across megabases of DNA. The olfactory receptor clusters located on chromosome 1 and chromosome 11 are less methylated in CPA compared to controls (scale log2 fold differences: −0.2 to 0.2). C. On chromosome 19, one of the few megabase regions showing decreased methylation in CPA compared to controls contains one of the two human micro-RNA clusters (scale log2 fold differences top and bottom panels: −0.2 to 0.2). D. Methylation dependences across megabases are shown. Pearson correlations of DNA methylation differences between controls and CPA groups at various genomic distances are shown. Error bars show 95% confidence intervals for the correlation values. The grey highlight shows the expected 95% confidence interval if there is no correlation between methylation differences at different genomic sites. This confidence interval does not overlap with the error bars associated with distances less than 2 Mb suggesting the existence of systematic dependencies between methylation differences at distances up to 2 Mb.

