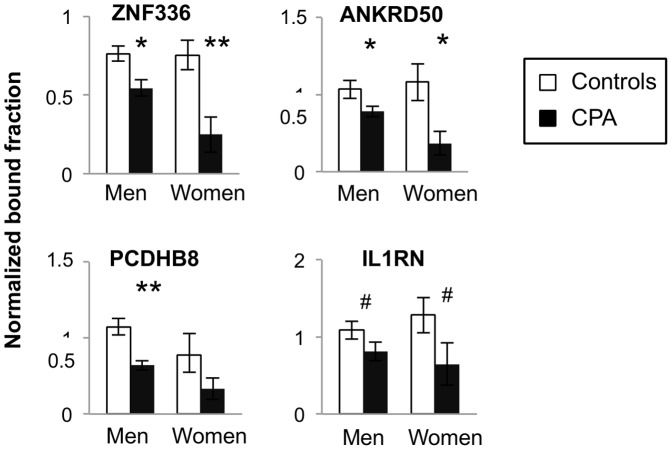
Figure 3. Q-MeDIP analysis in women T cells of four promoters that are differentially methylated between CPA and control groups in men.
Q-MeDIP analysis of DNA methylation differences between CPA (black) and control (white) groups in men and women T cells samples for four gene promoters predicted to be more methylated in the men CPA group by microarray analysis. Relative bound fraction concentrations obtained in triplicate by Q-MeDIP are shown (see methods). All error bars represent standard error of the mean (SEM). The P value obtained from Mann-Whitney U test is represent by #≤0.1, *≤0.05 and **≤0.01.

