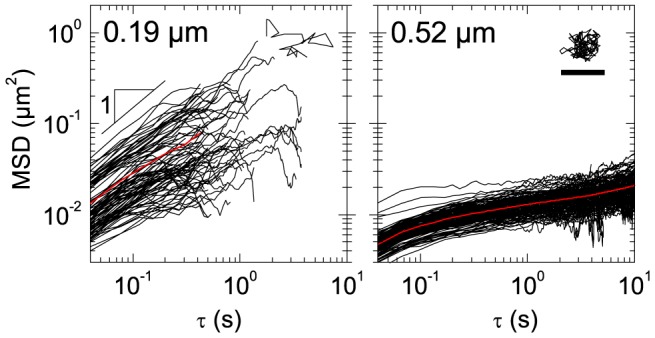
Figure 1. Determination of the mesh size by multiple particle tracking.

MSDs against time τ and the individual trajectories after τ = 3 s (inset) of microspheres with diameters of 0.19 and 0.52 µm at a K8/K18 concentration of 1.0 g/l (19.7 µM). The scale bar for the trajectory shown in the right panel denotes 500 nm and is the same in both panels and directions. The red line represents the average MSD.
