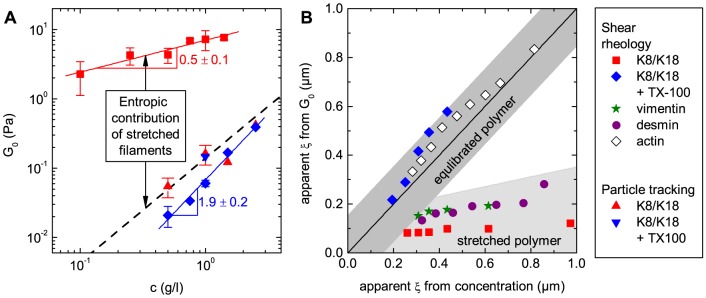
Figure 5. Influence of protein concentration on G 0 and comparison of the respective apparent mesh sizes ξ.

(A) presents G 0 data obtained from shear rheology and particle tracking at ω = 1 rad/s as a function of K8/K18 concentration. The dotted line shows the results obtained by equation (4). (B) Comparison of the mesh sizes ξ for different biological filament networks calculated from protein concentration using the cubic grid model in equation (1) with the mesh size calculated from the plateau modulus G 0 according to equation (3). The data used for K8/K18 is the same as in (A). Data for vimentin and desmin were taken from [7]. Actin data was extracted from Fig. 3 in [8]. The dark grey zone illustrates the region where the simplistic model can be used to calculate the mesh size of networks from G0 with an uncertainty of ±0.15 µm. This holds if the filaments are in thermal equilibrium. The light grey area shows that this is not the case for many IF-networks.
