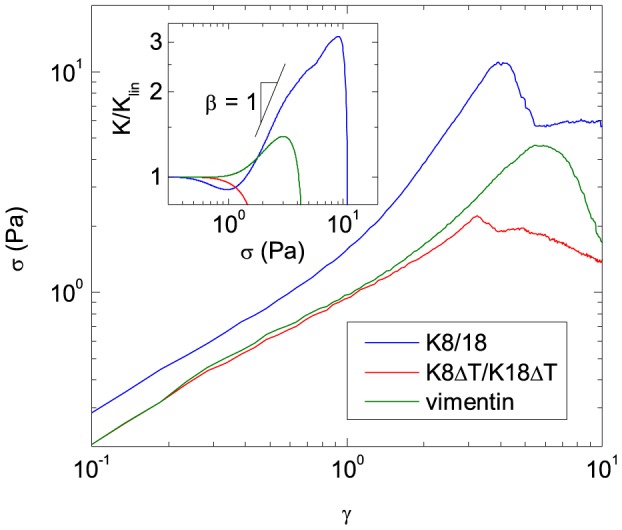
Figure 6. Shear stress σ versus deformation γ of different IF protein networks measured in steady shear.

The concentration of K8/K18 and K8Δ/K18ΔT is 9.8 µM. The vimentin concentration is 16.8 µM. Measurements were done at a constant shear rate  . Inset: The differential modulus K derived from the stress-strain curves normalized by its value at small stresses K
lin as a function of σ.
