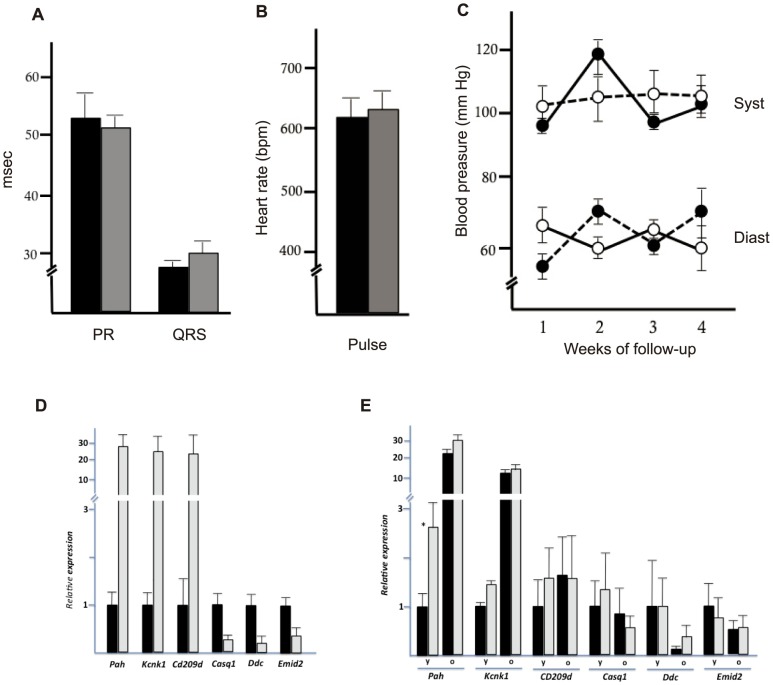
Figure 2. Heart molecular signature and cardiovascular phenotype of Polμ−/− mice.
(A–C) Cardiovascular parameters in old Polμ−/− (gray) and wt (black) mice (16–18 m). (A) Electrocardiographic parameters; QRS complex and PR segment intervals are shown in miliseconds (msec). (B) Heart rate (beats per minute; bpm). Data are means ±SD of weekly readings collected over a 4-week period. (C) Systolic and diastolic blood pressure (mm Hg) in wt (black) and Polμ−/− mice (white) over a 4-week period. Results are means ± SD (n = 3 mice). (D) After DNA array expression analysis of hearts from old (20–24 m) and young (3–4 m) wt mice, six genes showing an aging-related profile were selected and confirmed by qRT-PCR. Data from old mice (black) are presented relative the expression level of each gene in young mice (gray). (E) Comparative gene expression analysis in young (y; 8–12 weeks) and old (o; 20–24 m) heart tissue from wt (black) and Polμ−/− mice (gray). Data were normalized to the expression level of each gene in young wt mice. Results, expressed as 2∧–(DCT), are mean values ± SD (n = 3).

