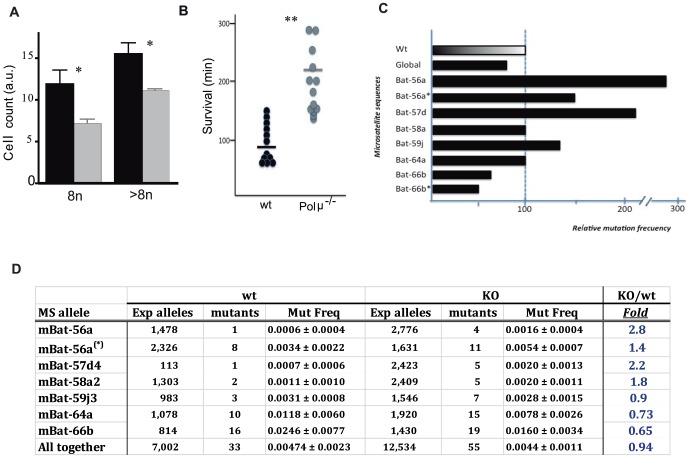
Figure 4. Genetic stability in Polμ−/− mice.
(A) Polyploidy (determined by PI staining) in hepatocytes from old (14 m) wt (black) and Polμ−/− mice (gray). Data are presented as the relative amounts (arbitrary units) of 8n and ≥8n cells (means ± SEM, 4 samples per genotype. (B) Survival (min) of adult (8–12 w) mice after i.v. injection with paraquat (70 mg/kg). Individual data and means are shown for wt (black) and Polμ−/− (gray) mice (n = 13). Data are means ± SEM. (C, D) Comparative mutation frequency (MF) in a panel of selected microsatellites (MS) in Polμ−/− mice vs wt animals. The table (D) compares individual absolute MF values in the different MS sequences analyzed in Polμ−/− mice relative to wt animals (100%); (*) indicates animals treated with paraquat.

