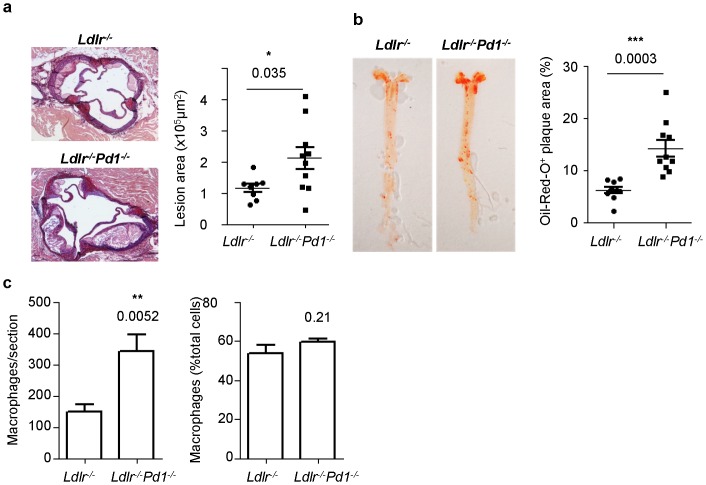
Figure 8. Increased atherosclerotic lesion formation in Ldlr−/−Pd1−/− mice.
a) Representative images and quantitative analysis of atherosclerotic lesion size in the aortic sinus of Ldlr −/− or Ldlr −/− Pd1 −/− mice after 9 weeks of high fat diet feeding. b) Representative images of Oil-Red-O stained aortae and quantitative analysis of atherosclerotic lesion size in the aorta of Ldlr −/− or Ldlr −/− Pd1 −/− mice after 9 weeks of high fat diet feeding (n = 8–10/group). (c) Quantitative analysis of Mac2+ monocyte/macrophage numbers and frequencies among total plaque cells in the aortic sinus of Ldlr−/− and Ldlr−/−Pd1−/− mice after 9 weeks of high fat diet feeding (n = 5–9/group). *p<0.05 **p<0.01 ***p<0.001.

