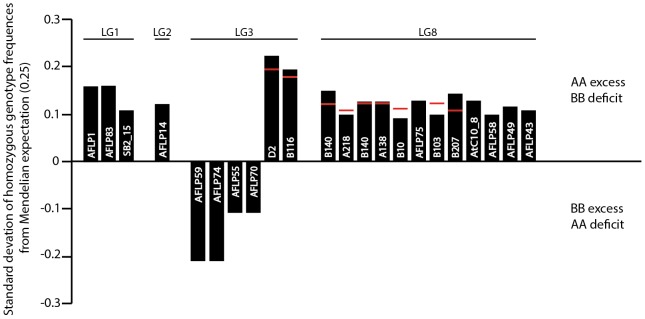
Figure 2. Transmission ratio distortion across the Draba nivalis linkage map.

Histograms indicate the direction and magnitude of deviation of the parental homozygote frequency from the Mendelian expectation of 0.25 as positive in case of AA (male) excess and BB (female) deficit, or negative in case of AA deficit and BB excess. For dominant markers, either the AA or BB excess / deficit is indicated by the black bars. For co-dominant markers, the black bar indicates the AA excess, whereas the red lines indicate the BB deficit.
