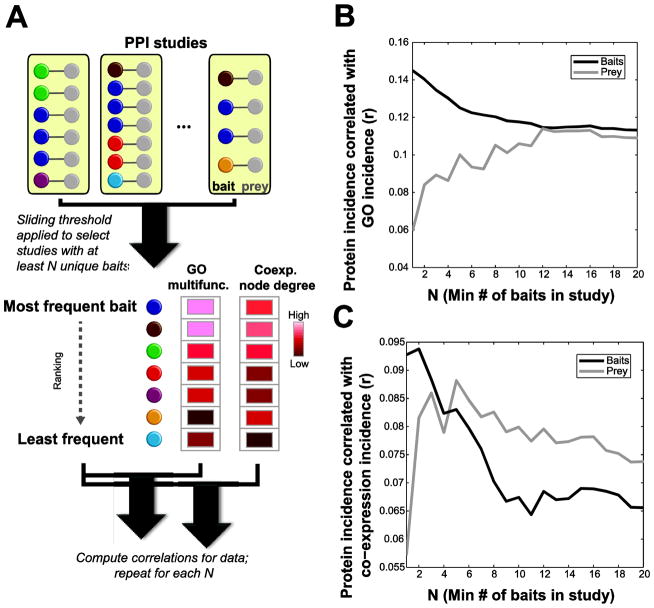
Figure 1.
Relationships between study size and external knowledge. A: Schematic explaining the data and analysis shown in B and C (bait analysis illustrated). The number of studies each bait appears in was computed. Then the subset of studies at or below the threshold number of baits N was selected. Within this subset, the number of interaction each bait had was correlated with either multifunctionality (plotted in B) or co-expression node degree (plotted in C). This was repeated for each threshold of N up to 20 baits. B: Relation between study size (number of baits) and agreement with GO, for baits (black line) and preys (grey line). C: As in B but using co-expression instead of GO as the comparator.

