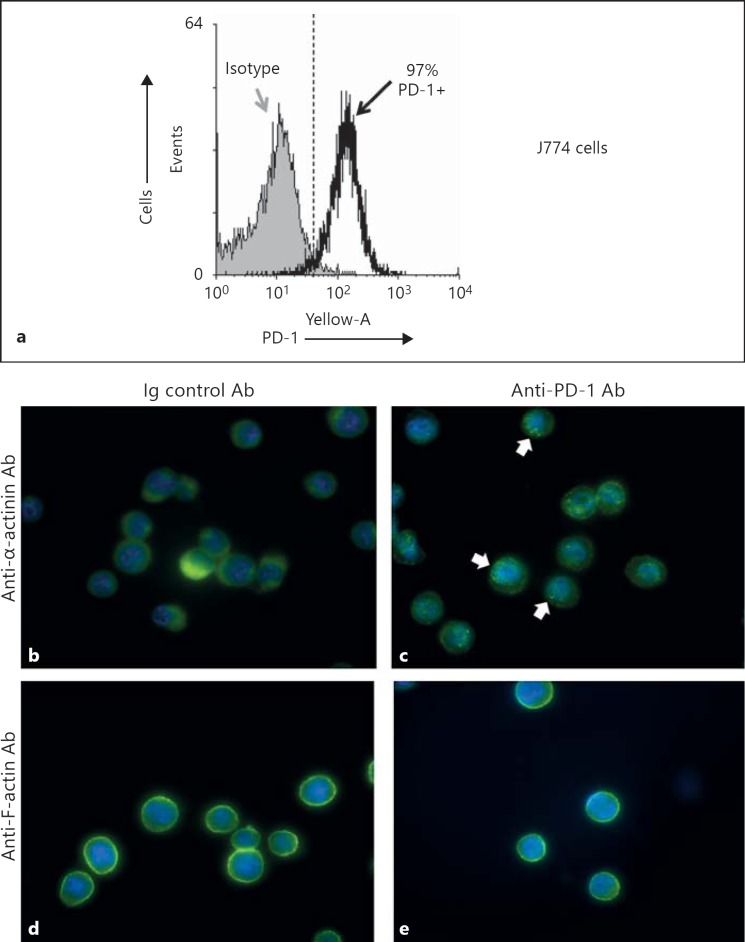
Fig. 4.
J774 cells exhibit altered cytoskeletal immunefluorescent staining pattern for either anti-α-actinin or anti-F-actin when incubated with anti-PD-1 blocking antibody but not control IgG. a Staining J774 cells with anti-PD-1 show that ∼97% of cells are PD-1+, as determined by flow cytometry and depicted in the representative histogram. b, c Differences typically observed in the α-actinin-stained cells [in green for FITC- vs. DAPI-stained nuclei (blue); magnification ×40] treated with a non-specific IgG (control antibody; b) versus those treated with anti-PD-1 (c). Arrows point to area aggregations that contribute to a punctate pattern of their staining for α-actinin. d, e Illustration of the staining pattern typically observed in the F-actin-stained cells [in green for FITC- vs. DAPI-stained nuclei (blue); magnification ×40] treated with a non-specific-IgG (control antibody; d) versus those treated with anti-PD-1 (e).

