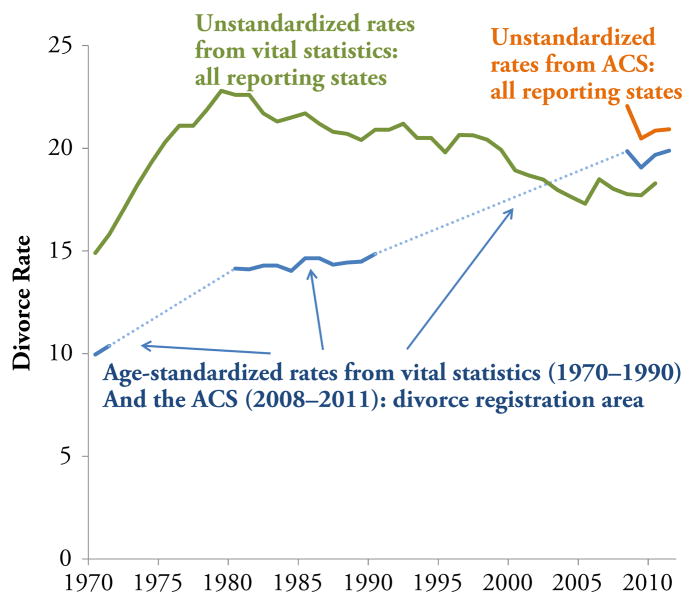
Fig 3.
Comparison of age-standardized and unstandardized divorces per 1,000 married women. Note: Standard population = married women in 2010. Unstandardized rates for ACS based on vital statistics reporting states in 2010 (44 states and the District of Columbia). Age-standardized rates are calculated based on age-specific rates published in 1970 and for the decade from 1980 to 1990, and for 2008–2011 for the Divorce Registration Area (29 states and the District of Columbia). The difference between the standardized and unstandardized ACS rates in 2010 results from the differing geographic footprint. Sources: Unstandardized rates, see Fig. 1. Standardized rates, 1970, 1980, 1984–1990: Clarke (1995); 1982–1983: National Center for Health Statistics (1985: table 6); 2008–2011: Ruggles et al. (2012)

