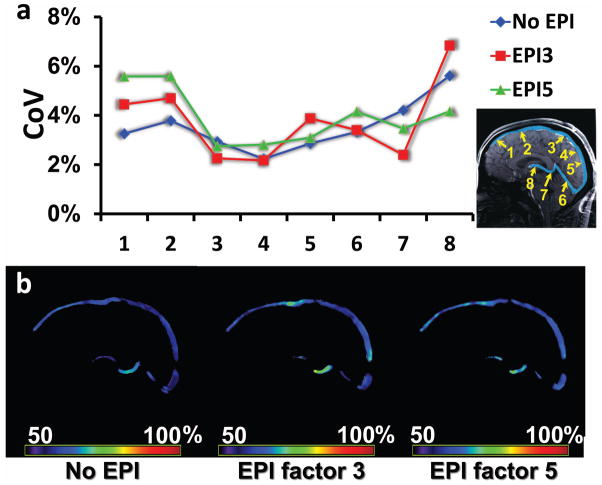
Figure 6.
Reproducibility of TRU-PC MRI. (a) Coefficient of Variation (CoV) for 8 regions (see inset). Data using different acquisition schemes are shown. The blue curve represents the standard (no EPI, or EPI factor 1) TRU-PC, the red curve represents the EPI-factor 3 TRU-PC, and the green curve represents the EPI-factor 5 TRU-PC. There is no significant difference between the CoV values for different acquisition schemes. (b) Representative TRU-PC Yv maps obtained using different acquisition scheme. From Left to Right: standard (no EPI) TRU-PC, EPI-factor 3 TRU-PC, and EPI-factor 5 TRU-PC. The color bar describes the oxygen saturation from 50 to 100%.

