
Figure 7.
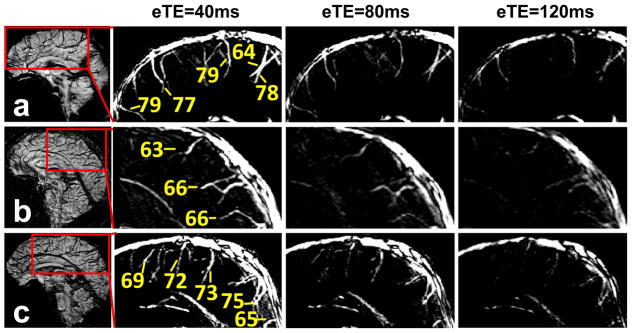
TRU-PC applied to pial veins. Three healthy subjects were studied and the data are individually shown in Panels a through c. Left-hand image in each panel: A sagittal SWI image showing dark veins in contrast to bright tissue signal. The SWI image was used for localization of veins in the TRU-PC image. The red box indicates the region chosen for the subsequent TRU-PC analysis. The zoomed TRU-PC images for eTE 40, 80, and 120 ms show appreciable decay in the pial veins draining into the SSS. Estimated Yv of discernible pial veins are listed in the image.