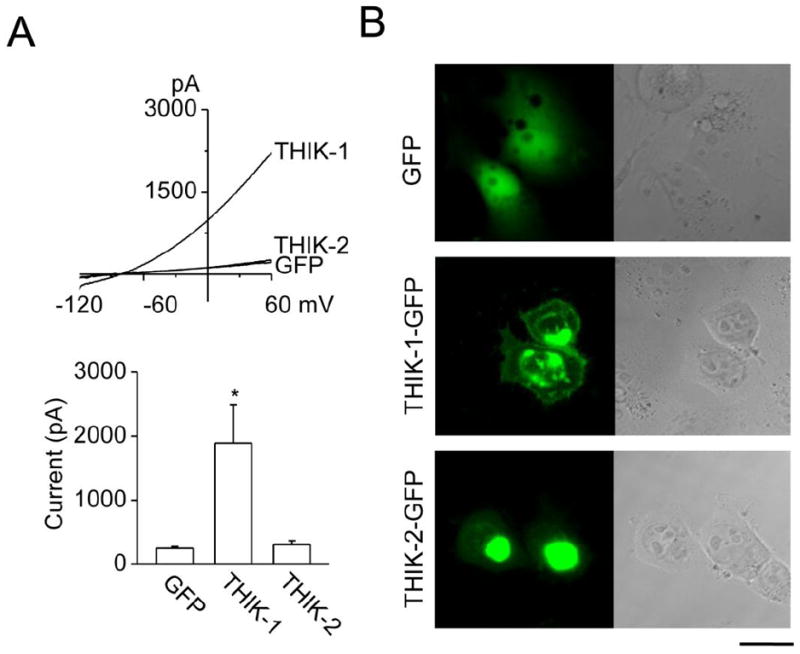
Figure 2. THIK-1 whole-cell current and expression patterns in HEK293 cells.

A. Whole-cell currents were recorded from HEK293 cells transfected with THIK-1 and GFP, THIK-2 and GFP or GFP alone (top). Current levels at +60 mV were determined and plotted (bottom). Each bar is the mean±SD of 6 determinations. Asterisk indicates a significant difference from the control value (GFP alone, p<0.05).
B. Expression patterns of THIK-1-GFP and THIK-2-GFP in HEK293 cells are shown. GFP is joined to the C terminus of THIK. Left and right panels show green fluorescent and phase contrast images, respectively. Scale bar=20 μm
