
Figure 4. Inhibition of THIK-1 current by cold.
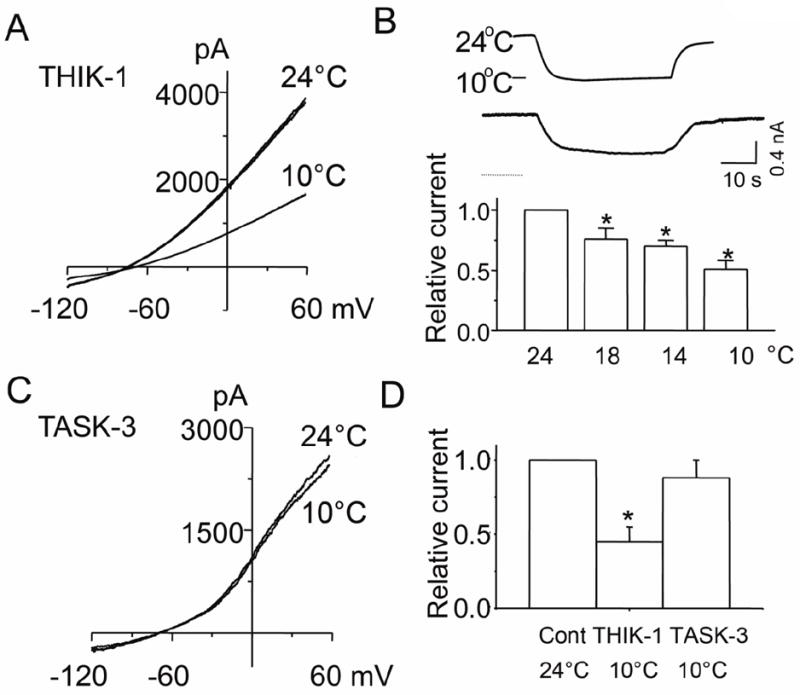
A. Tracing shows THIK-1 whole-cell currents recorded at 24°C and 10°C. Cells were held at -80 mV, and voltage ramps applied from -120 mV to +60 mV.
B. Tracing shows whole-cell holding current while changing the temperature of the perfusion solution from 24°C to 10°C, and back to 24°C. Whole-cells were held at -60 mV. Relative currents at different temperatures are also shown in the bar graph (mean±SD from 10 cells)
C. Tracings show whole-cell currents of TASK-3 recorded at 24°C and 10°C.
D. Summary of the cold effect on THIK-1 and TASK-3 whole-cell relative currents. Each bar is the mean±SD of 10 determinations. Asterisk indicates a significant difference from the control value (p<0.05).