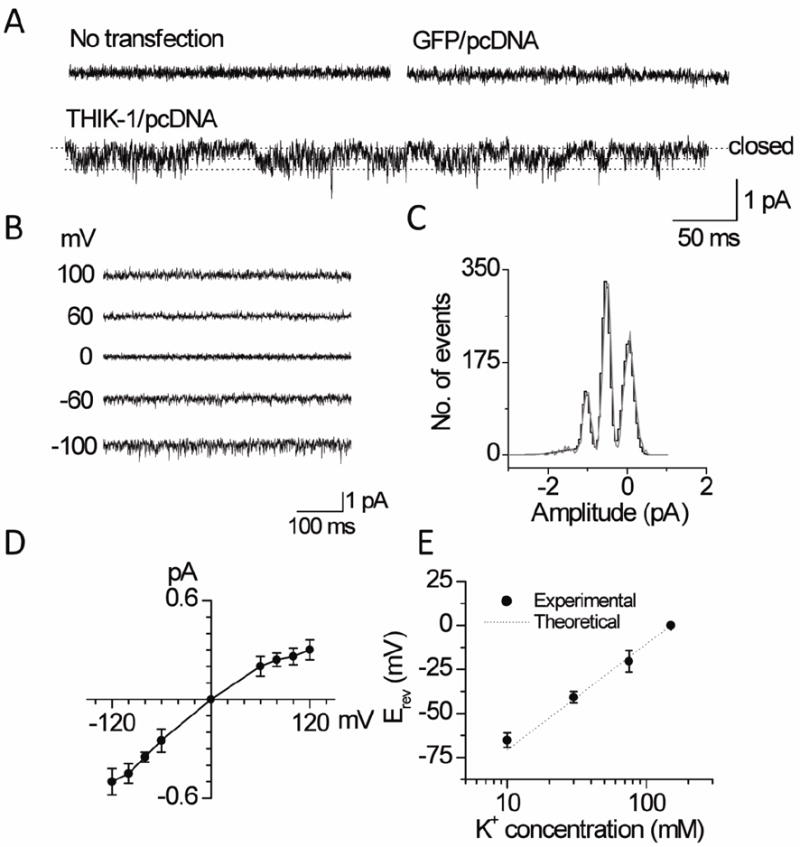
Figure 5. Single-channel properties of THIK-1.

A. Tracings show currents from cell-attached patches from untransfected cells and cells transfected with plasmid containing GFP and/or THIK-1 DNA. Cells transfected with THIK-1 DNA show low amplitude channel openings indicated by dotted lines.
B. Currents were recorded from inside-out patches held at various membrane potentials as indicated.
C. Plot shows an amplitude histogram of channel openings recorded at +100 mV (pipette potential). The histogram was fitted with a Gaussian curve.
D. Plot shows a single-channel current-voltage relationship of THIK-1.
E. Plot shows changes in reversal potential (Erev) at different [K+]o. Experimental and theoretical (Nernst Equation) data are shown.
