
Figure 6. Effects of halothane, AA and cold on THIK-1 and TASK-3 single-channel currents.
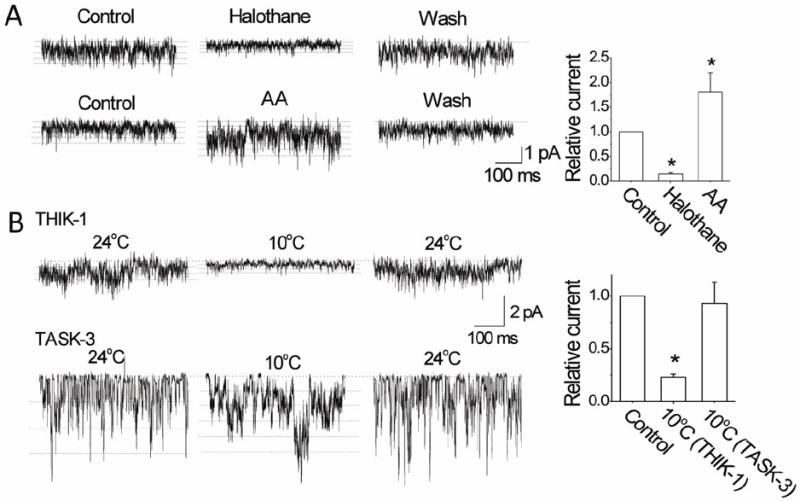
A. Tracings show single-channel currents recorded from outside-out patches before, during and after perfusion with halothane (2 mM) and AA (10 μM) in cells expressing THIK-1. Multiple openings are indicated by dotted lines. Halothane reduced the single-channel amplitude. Graph plots the relative currents (NPoi) produced by halothane and AA. Each bar is the mean±SD of 7 determinations.
B. Tracings show single-channel currents recorded from outside-out patches before, during and after perfusion with cold solution in cells expressing THIK-1 or TASK-3. Multiple openings are indicated by dotted lines. Cold reduced the single-channel amplitude. Graph plots the current (NPoi) change produced by cold. Each bar is the mean±SD of 10 determinations. Asterisk indicates a significant difference from control (p<0.05).