
Figure 7. Lack of effect of hypoxia and mitochondrial inhibitors/uncoupler on THIK-1 current.
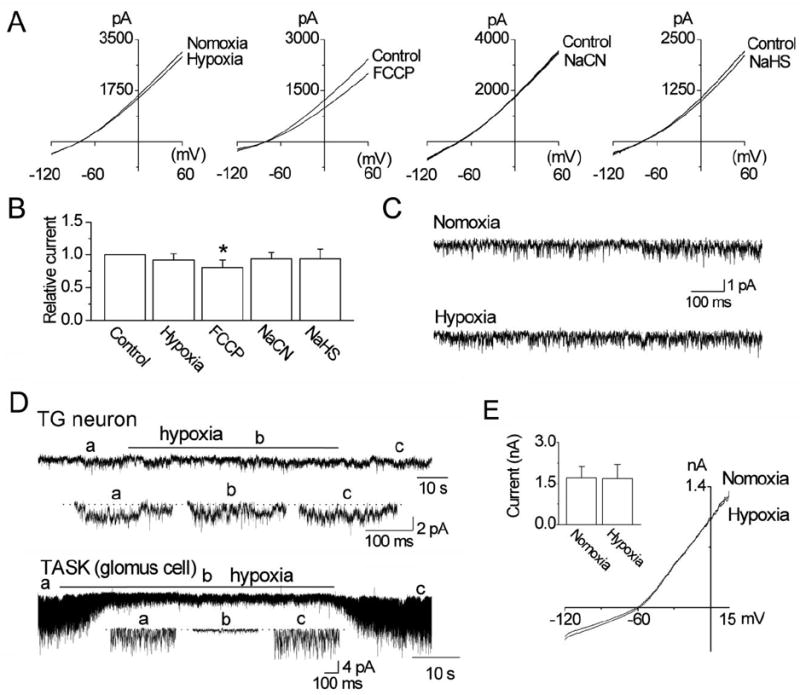
A. Graphs show whole-cell currents before and after exposure to hypoxia, FCCP (1 μM), NaCN (1 mM) and NaHS (100 μM) in HEK293 cells.
B. Summary of the experiments in A. Each bar is the mean±SD of 10 determinations. Asterisk indicates a significant difference from the control value (p<0.05).
C. Tracings show THIK-1 channels before and during exposure to hypoxia. No significant difference was found between the two (p>0.05).
D. Current tracings are from cell-attached patches from a TG neuron and a carotid body glomus cell perfused with normoxic and hypoxic solutions. Expanded tracings are also shown as indicated below each tracing.
E. Whole-cell currents from a TG neuron before and after hypoxia. The bar graph shows current measured at +15 mV. No significance was present (p>0.05).