
Figure 8. Properties and expression of THIK-1 in TG neurons.
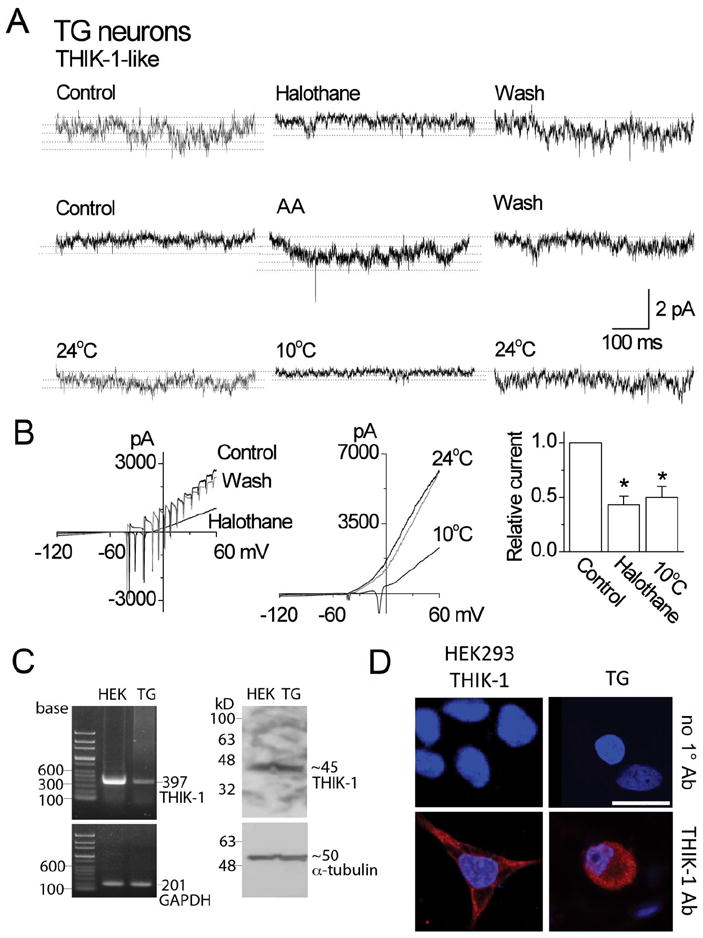
A. Tracings show single-channel currents in cell-attached patches of TG neurons. Pipette potential was +100 mV. Effects of halothane, arachidonic acid and cold are shown. Dotted lines indicate the open levels.
B. Whole-cell current tracings show the effect of halothane and cold in TG neurons. The bar graph shows the relative inhibition of the current by halothane and cold (mean±SD). Asterisks indicate a significant difference (p<0.05; n=5 each).
C. RT-PCR shows an expected 397-bp band from both HEK293 cells expressing THIK-1 and rat TG neurons (left panel). GADPH was used as control (201-bp). Western blot analysis shows ~45 kD band when immunoblotted with THIK-1 antibody (right panel). α-tubulin was used as a loading control (50 kD). The exposure time for α-tubulin was much shorter than that for THIK-1.
D. Immunocytochemistry shows positive staining (red) in both HEK293 cells expressing THIK-1 and rat TG neurons. Cells were stained with DAPI to identify nucleus (blue). In the absence of THIK-1 primary antibody (1°Ab), only nuclear staining (blue) was observed. Scale bar=20 μm