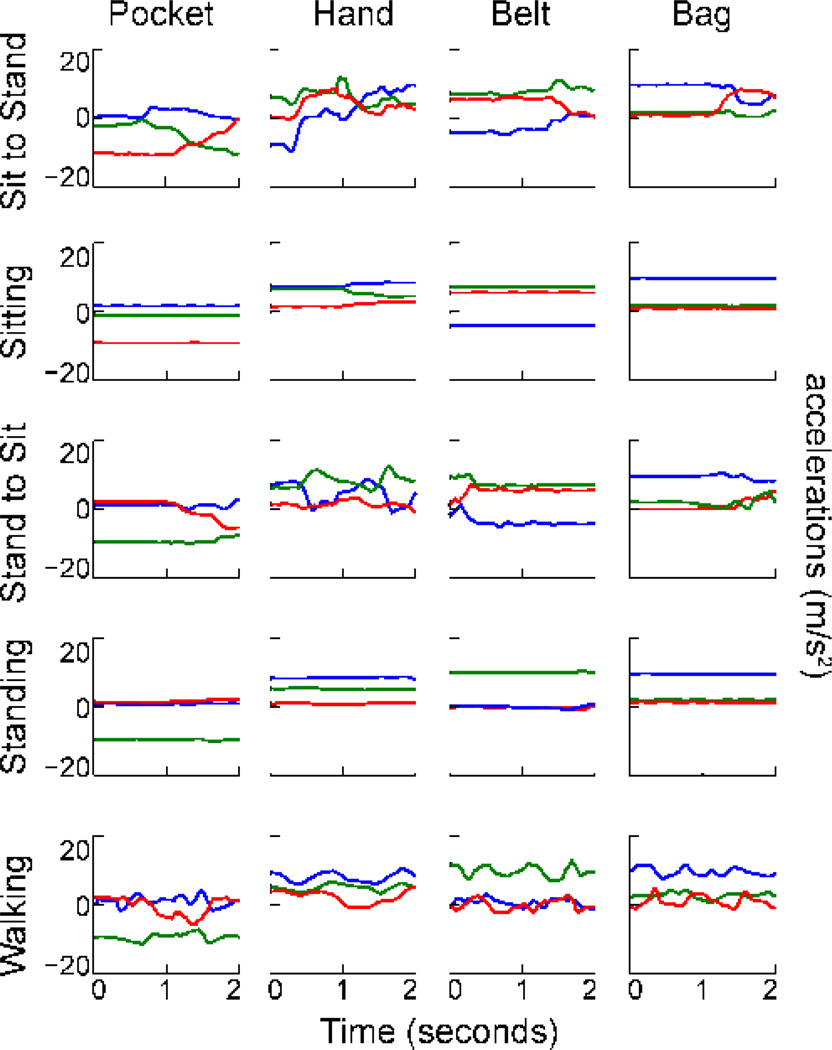
Figure 3. Raw data clips.
Example data clips for each activity location pair for one subject. Note the accelerations recorded by the phone are different for each activity across the four phone locations. The blue, red and green lines correspond to the X, Y, and Z axes of the phone’s accelerometer, respectively.

