
Figure 8.
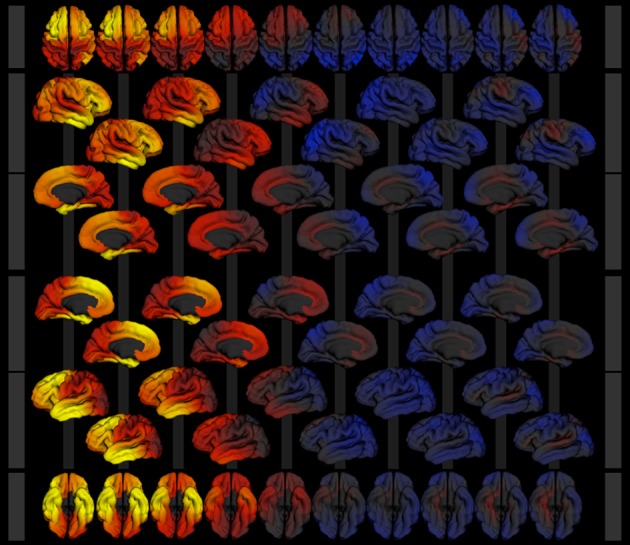
Image collage of surface models exported from the surface viewer application for the model described in section 3. Cortical area expansion factor is mapped as color (red—expansion, blue—contraction) over age (3–21 years, left to right) given the model described in section 3. Rows show superior (1), right lateral (2 and 3), medial view of the right hemisphere (4 and 5), medial view of the left hemisphere (6 and 7), left lateral (8 and 9), and inferior (10) views of the 3d surface model.