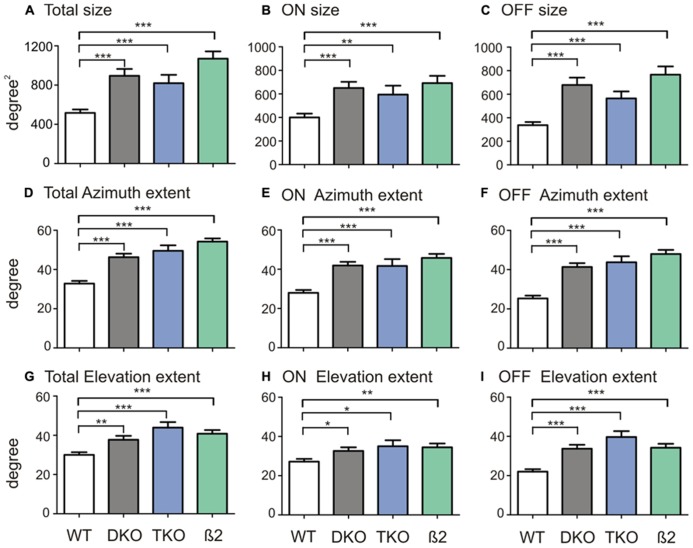
FIGURE 2.
Quantification of SC receptive field structures. (A) Comparison of receptive field size between SC neurons in WT mice and ephrin-A DKOs, TKOs, and nAChR-β2 KOs. (B) Comparison of the ON subregion size between groups. (C) Comparison of the OFF subregion size between groups. (D–F) Comparison of receptive field extent along the azimuth axis (D) and that of the On (E) and Off subregions (F) between groups. (G–I) Comparison of receptive field extent along the elevation axis (G) and that of the On (H) and Off (I) between groups. All error bars represent SEM, and *p < 0.05, **p < 0.01, and ***p < 0.001.

