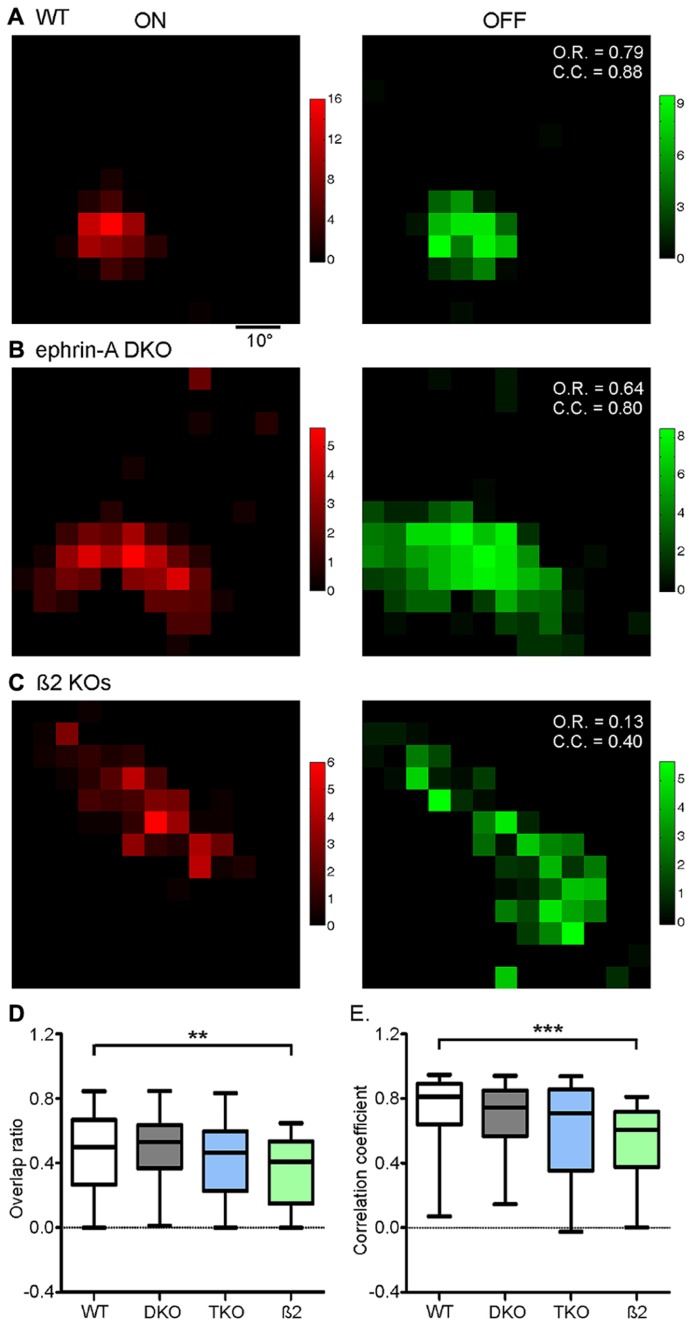
FIGURE 3.
On–Off overlap is disrupted in nAChR-β2 KOs, but not in ephrin-A KOs. (A) On (red) and Off (green) responses of a WT SC neuron, showing substantial On–Off overlap. Color scales represent evoked responses in spikes/s during the 500 ms duration of stimulus presentation. The calculated values of overlap ratio (O.R.) and correlation coefficient (C.C.) are listed at the upper right corner of the “Off” plot. (B) On and Off responses of an example neuron in ephrin-A DKO mice. (C) Responses of an example neuron in nAChR-β2 subunit knockout. (D) Comparison of On–Off overlap ratio between genotypes, with only β2 KOs showing a significant disruption comparing to the WT. (E) Comparison of On–Off correlation coefficient between genotypes. Panel D and E are box plots with ends of each plot representing 5th and 95th percentiles. **p < 0.01 and ***p < 0.001.

