FIGURE 4.
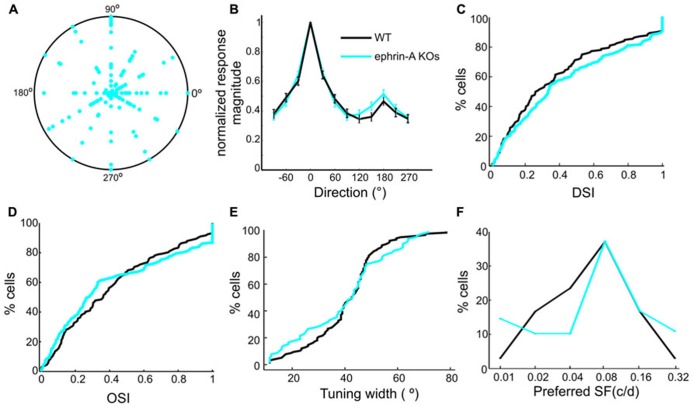
Normal responses to drifting gratings in ephrin-A KOs. (A) Polar plot of direction selectivity index (DSI, radii from origin) and preferred directions (angles). Each dot is from one cell. The outer circle represents DSI value of 1. (B) Normalized direction tuning curve of ephrin-A KOs and WT SC neurons, plotting the mean and SEM of normalized responses at each direction. (C) Cumulative distribution of DSI in the two genotypes (ephrin-A KOs, mean = 0.43 ± 0.03, median = 0.33, n = 137; WT, mean = 0.38 ± 0.03, median = 0.27, n = 132; p = 0.42, K–S test). (D) Cumulative distribution of OSI in the two genotypes (ephrinA-KOs, mean = 0.41 ± 0.03, median = 0.28, n = 137; WT, mean = 0.41 ± 0.03, median = 0.36, n = 132; p = 0.15, K–S test). (E) Cumulative distribution of tuning width (p = 0.41, K–S test). (F) Distribution of preferred spatial frequency. Similar percentage of cells in the two genotypes preferred 0.08 cpd and 0.16 cpd.

