Figure 3.
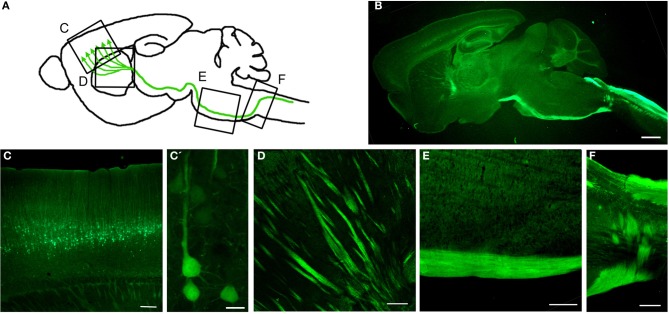
Genetic Labeling of CSMN. (A) Schematic drawing of genetic labeling of CSMN by eGFP expression under control of UCHL1 promoter. (B) A representative sagittal section of a P120 mouse brain showing eGFP+ CSMN and their axons. (C) In motor cortex, eGFP+ CSMN can be seen in layer 5a and 5b. (C') Higher magnification of individual representative eGFP+ CSMN in the motor cortex. (D–F) eGFP+ axons of CSMN projecting through the striatum (D), pons (E), and pyramidal decussation (F). Scale bars: (B) = 1 mm, (C,D and E) = 200μ m, (C') = 20μ m, (F) = 500μ m.

