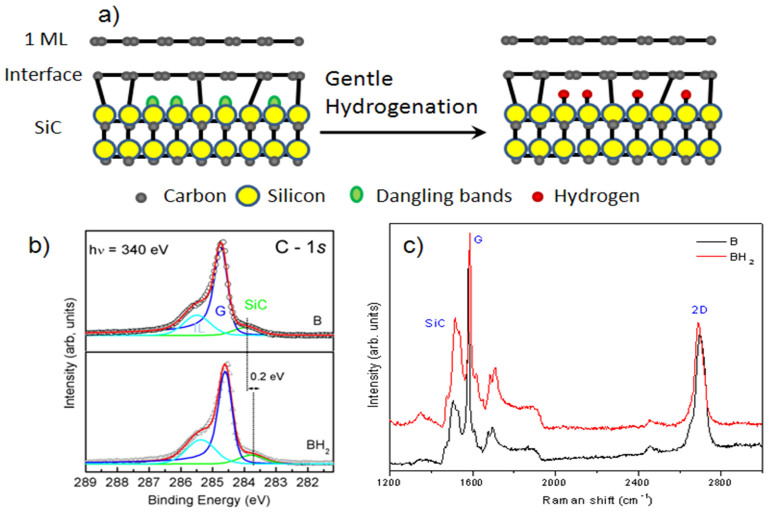
Figure 1. Structural Properties of Epitaxial single-layer graphene after hydrogenation.
a) Schematic representation of hydrogenation process: after hydrogen exposure the Si dangling bonds between SiC and interface are saturated by hydrogen. (b) C 1s XPS spectra for epitaxial graphene after hydrogenation at 820°C at hν = 340 eV. XPS measurements were performed at φ = 45° emergency angle with respect to the sample normal. This spectrum shows the presence of the interface layer after hydrogenation. c) Typical Raman spectra of the graphene sample after hydrogenation. Contributions at the G and 2D band are observed, together with a very low signal at the defect band D.

