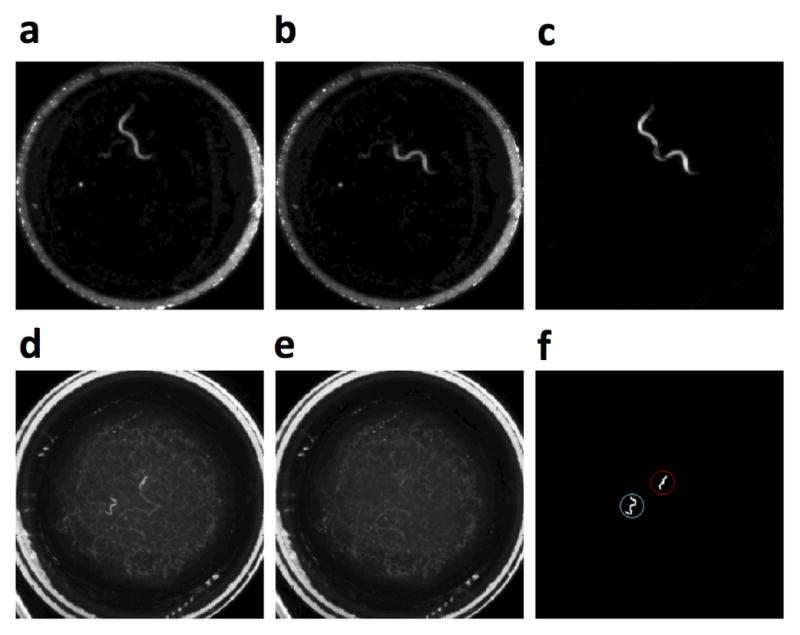
Fig. 2.

Image processing. (a–c) Development experiments. (a) A region of interest containing a single N2 L4 hermaphrodite. (b) Same region 3 seconds later. (c) Absolute difference between (a) and (b). Worm activity is represented by the sum of all pixel intensities in this image. (d–f) Mating experiments. (d) A region of interest containing an N2 adult male and an N2 adult hermaphrodite. (e) Calculated background image of the same region of interest. (f) Image containing only the animals, generated by subtracting (e) from (d). Red (upper right) and blue (lower left) circles denote the hermaphrodite and male, respectively.
