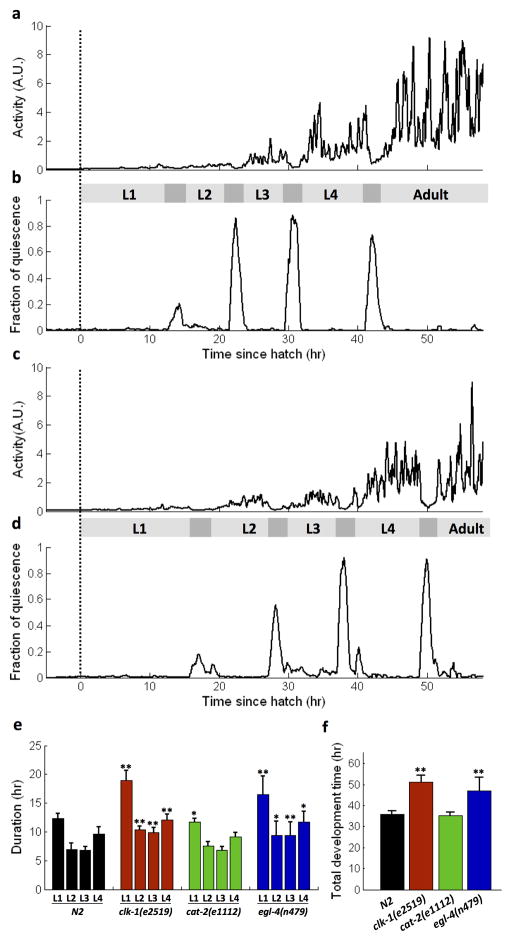
Fig. 3.
Monitoring animal development from embryo to adulthood. (a–b) A representative N2 wild type animal. (c–d) A representative clk-1(e2519) mutant. Dotted line represents hatch time of the animal. The gray bar between the activity and fraction of quiescence plots indicates non-lethargic (light) and lethargic (dark) periods. Activity is averaged over a 15-minute window, whereas the fraction of quiescence is average over a 30-minute window. (e) Duration of developmental stages strains N2 (n=39), clk-1(c2519) (n=10), cat-2(e1112) (n=11), egl-4(n479) (n=11). Duration of each stage includes both non-lethargic and lethargic periods. Significance tests are performed in comparison to equivalent stages in N2. *P<0.05, **P<0.005 (2-tailed Student’s t-test). Absence of label represents P>0.05. (f) total development time for each strain.

