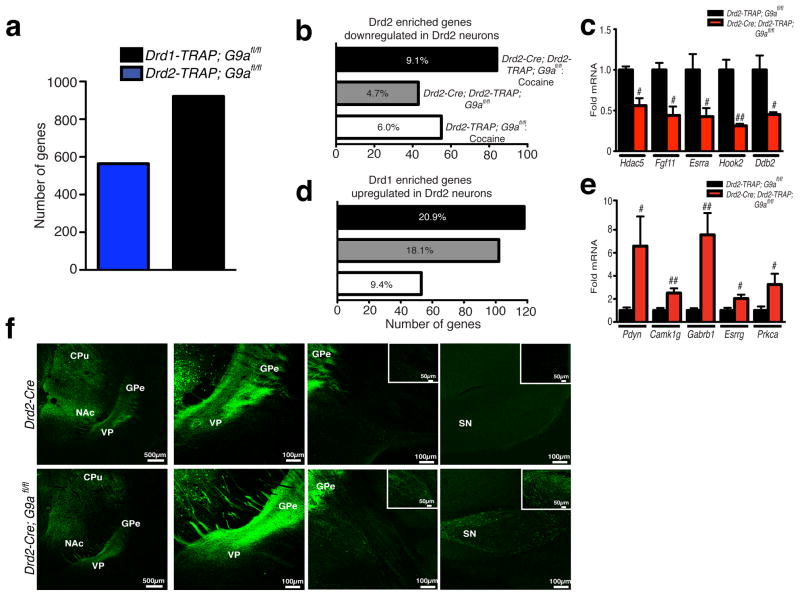
Figure 3. Selective loss of G9a in Drd2 MSNs results in the unsilencing of striatonigral specific gene expression profiles and abnormal afferent projections.
(a) Identification of Drd1 vs. Drd2 enriched gene expression profiles in striatum. (b) Numbers of Drd2 enriched genes displaying significant downregulation in Drd2 MSNs following repeated cocaine, G9a KO, or both. (c) Validation of Drd2 enriched genes downregulated by G9a KO selectively in Drd2 MSNs. (d) Numbers of Drd1 enriched genes displaying significant upregulation in Drd2 MSNs following repeated cocaine, G9a KO, or both. (e) Validation of Drd1 enriched genes upregulated by G9a KO selectively in Drd2 MSNs. Percentages indicate the number of Drd2 (b) or Drd1 (d) enriched genes displaying significant regulation by repeated cocaine, G9a KO, or both, divided by the total number of genes enriched within a given cell type. (f) Afferent projection terminal tracing demonstrates that selective loss of G9a in Drd2 neurons leads to abnormal ‘direct pathway’ projections to midbrain (substantia nigra) from Drd2 G9a KO MSNs in comparison to wildtype controls. Data are presented as averages ± SEM.

