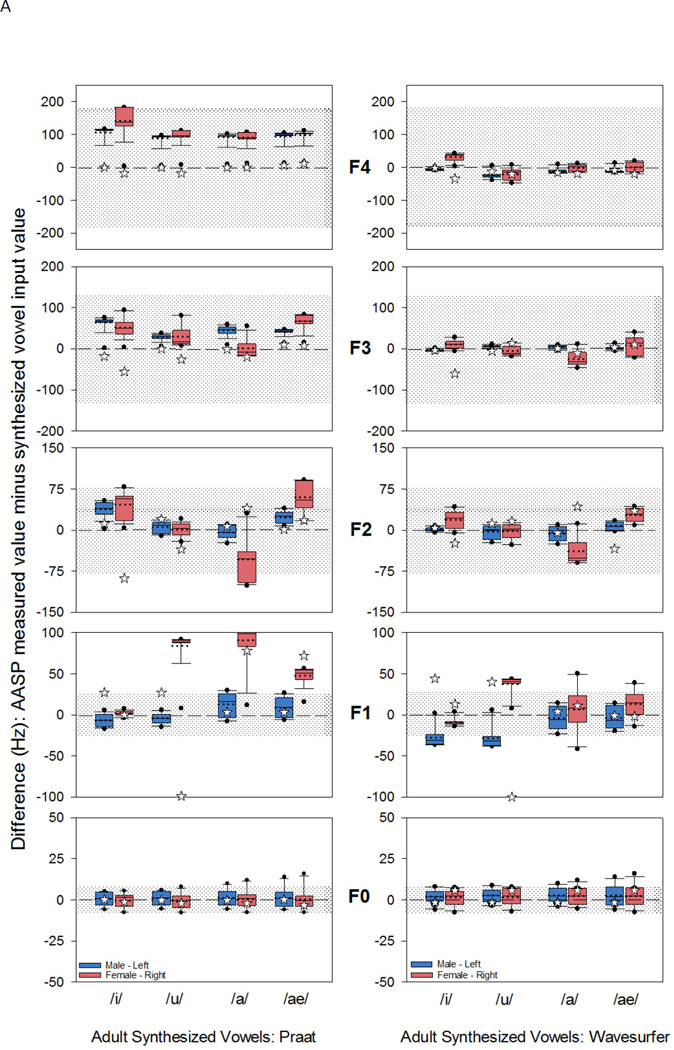
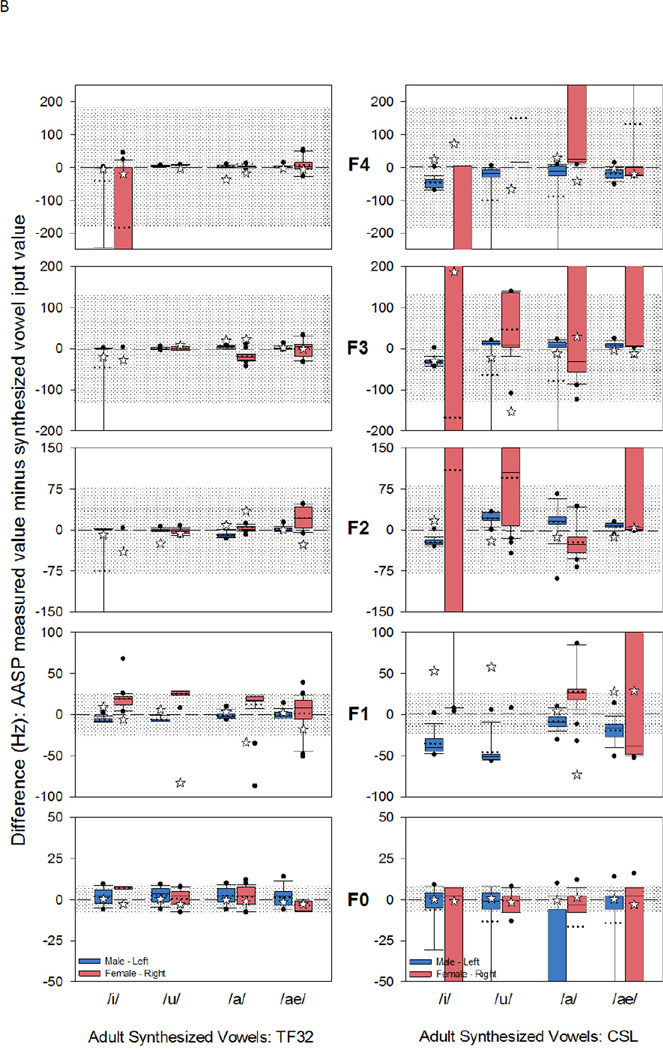
Figure 1.
A. Discrepancy scores for the fundamental frequency (F0) and formant frequencies (F1 to F4) for the four synthesized vowels. The box plots display the 25th and 75th percentile of the discrepancy scores, as well as the mode (solid line) and the median (dotted line). The whiskers display the 5th and 95th percentiles with the outlying data displayed as dots. The zero reference line is the measurement accuracy reference where zero discrepancy indicates no difference between the acoustic analysis software package (AASP) measured value and the input value for the synthesized vowel. The gray region above and below the zero reference line reflects ±5% range of synthesis input value. Manually measured F0 and F1-F4 are displayed with a star symbol. Left panel displays discrepancy scores using Praat, and the right panel Wavesurfer
B. Discrepancy scores for the fundamental frequency (F0) and formant frequencies (F1 to F4) for the four synthesized vowels, using TF32 (left panel) and CSL (right panel). The zero or accuracy reference line refers to no difference between the measured value and the input value for the synthesized vowel. Manually measured F0 and F1-F4 are displayed with a star symbol. For additional information regarding box plot or shaded region, refer to Figure 1A caption.


