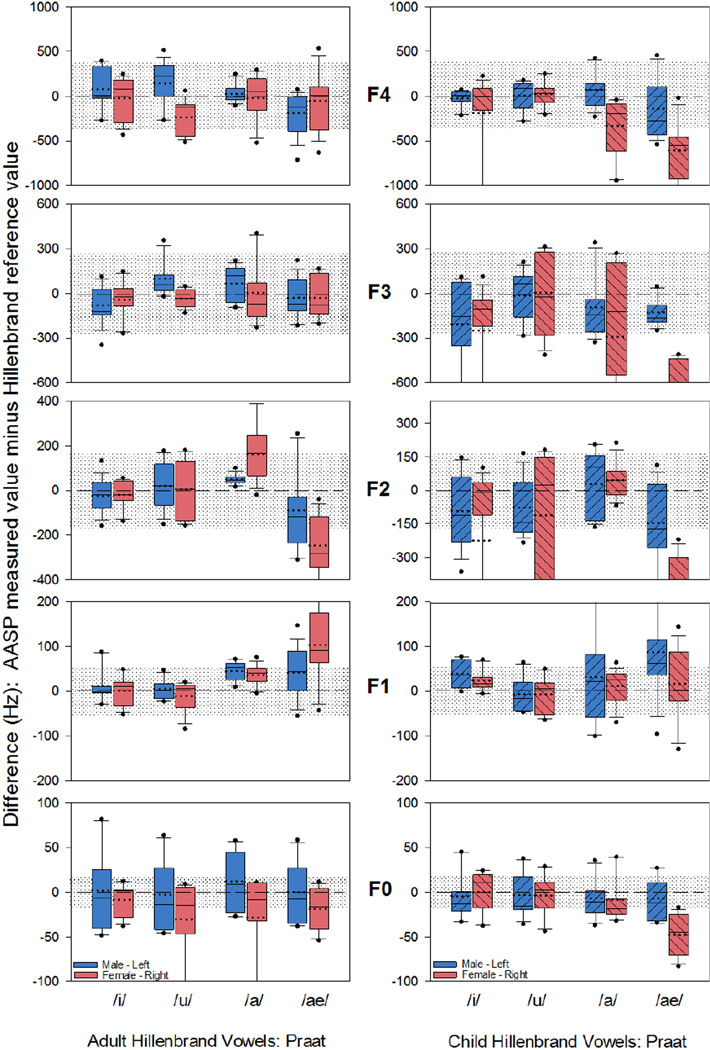
Figure 3.
Discrepancy scores using Praat for the adult male and female (left panel) and child male and female (right panel) speaker’s fundamental (F0) and formant frequencies (F1-F4) for the four Hillenbrand vowels. The box plots display the mean, 25th percentile value, and 75th percentile value for F0 and F1-F4, in addition to the mode (solid line) and the median (dotted line). The zero or accuracy reference line represents the Hillenbrand et al (1995) reported values averaged across the five speakers analyzed, and the shaded region reflects ± 10% of the this averaged value.

