
Fig. 1.
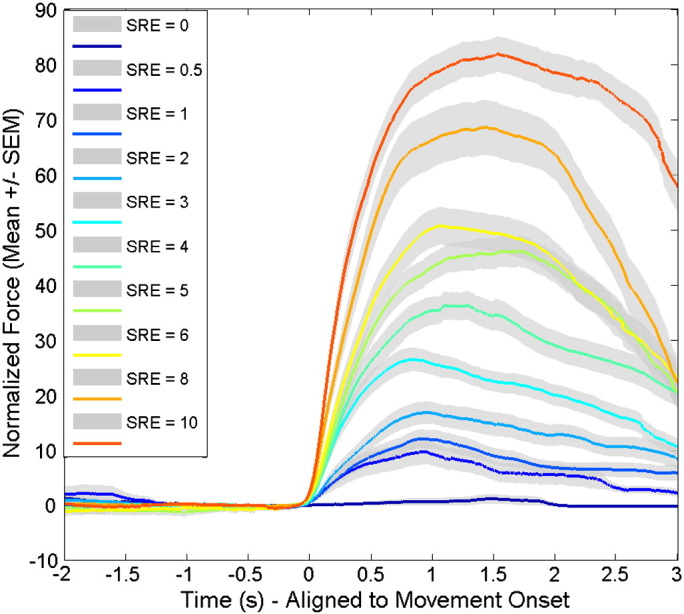
Force trajectories at different SRE levels. These have been normalized to peak force in the maximal effort trials for each hand and aligned to movement onset before averaging across hands. Lines are the average across subjects and shading represents the standard error.