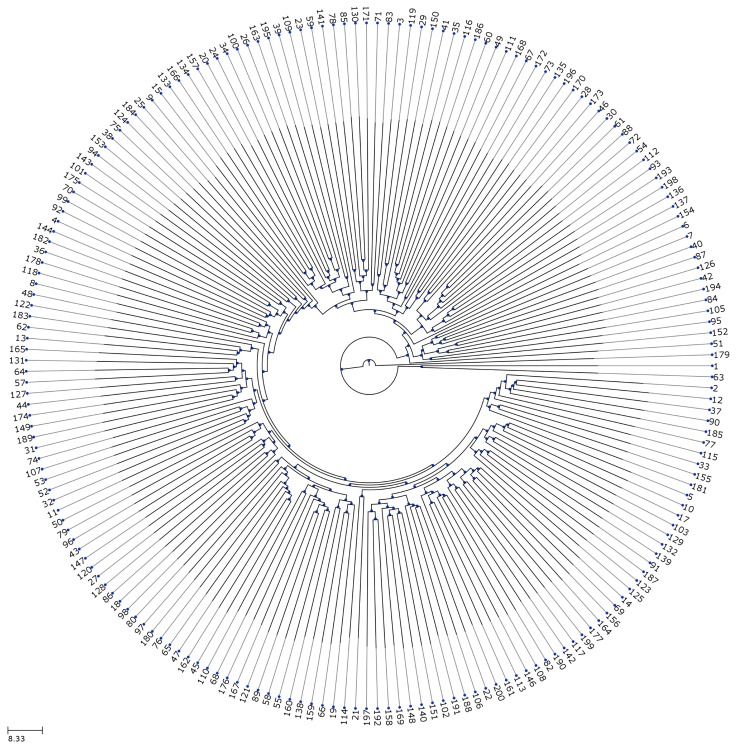
Figure 10.
A dendrogram visualizing the distances between 200 structures. Comparison of the structures resulting from 200 simulations by displaying the pairwise root mean square deviation (paired RMSD) using a dendrogram. The leaves are marked with the simulation index. An inner node close to the root denotes high dissimilarity between the branches of the node. The presented tree reveals only inner nodes very close to the root. This leads to the conjecture that all structures are microscopically different, but macroscopically similar. Considering structure 179 as an outlier, this implies that the given model produces exactly one structure.

