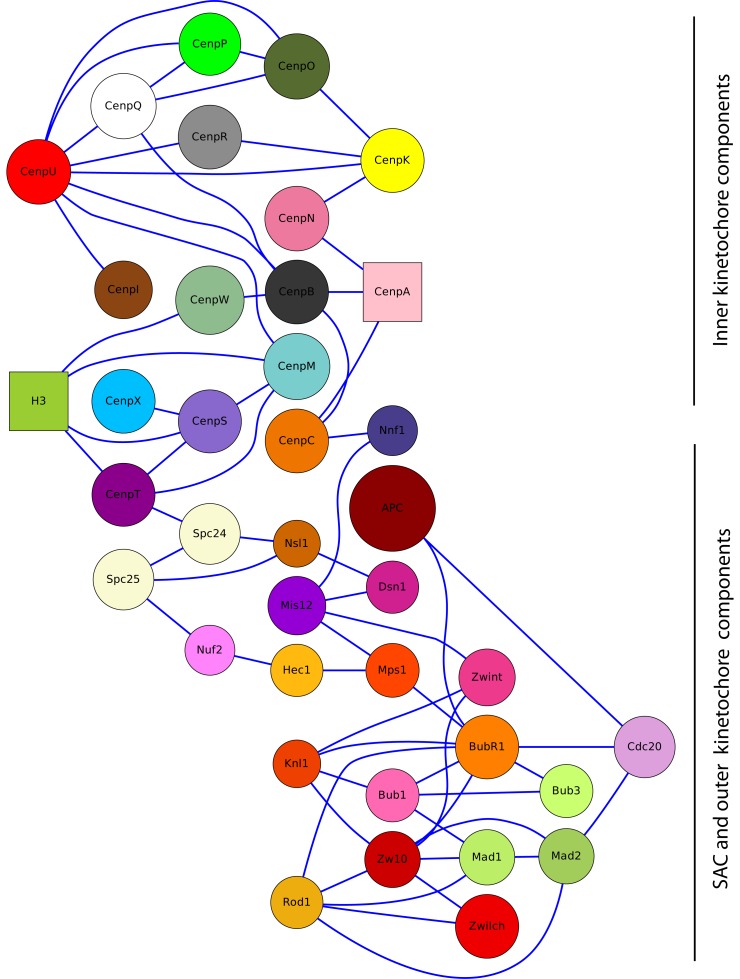
Figure 11.
Map of all interactions used for the Human Mitotic Kinetochore (HMK) model (see also Table 6). The nodes in this graph represent a protein or complex, while the edges depict interactions between them. The colors and names of the vertices are the same as in Figures 9 and 12. Square shapes are the two nucleosomes, which are the anchor points for our model calculations. The CenpA nucleosome contains CenpA1, CenpA2, H41, H42, H2A1, H2A2, H2B1 and H2B2. The H3 nucleosome contains H31, H32, H43, H44, H2A3, H2A4, H2B3 and H2B4.

