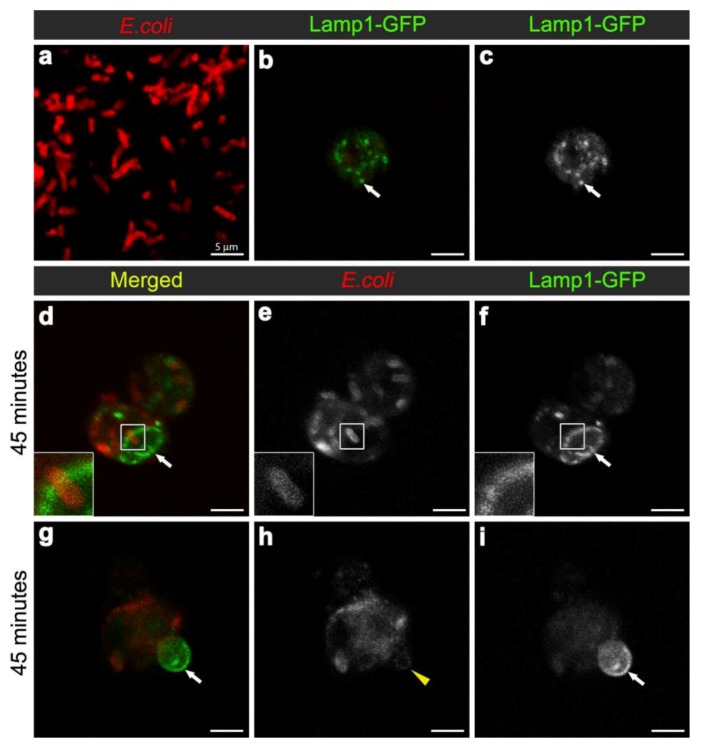
Figure 4.
Confocal micrograph of intact E. coli (red in (a), replicated from Figure 2a, for scaling purposes to illustrate the size and rod-shape of free E. coli). Confocal micrographs of Lamp1-GFP positive vesicles (expressed using CG-GAL4>Lamp1-GFP): in uninfected wild-type hemocytes as green (b) and grayscale (c) and depicted by arrows; and in hemocytes 45 minutes after infection as green (d, g) and grayscale (f, i) and depicted by arrows; with E. coli visualized as red (d, g), and grayscale (e, h). Inset in (d-f) depicts intact E. coli entering enlarged Lamp1-GFP compartment, framed in the main panels. Arrows in (g, i) depict Lamp1-GFP-positive bud in wild-type hemocyte, containing a low E. coli-positive signal designated by arrowhead in (h). Scale bars = 5 µm as labeled in (a).

