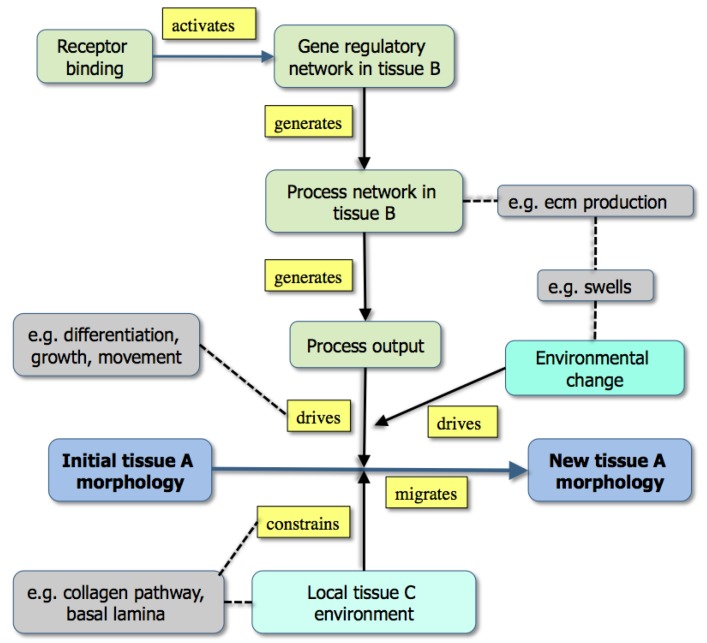
Figure 3.
A graph showing the modeling of morphogenesis either by the downstream effects of gene activity (upper part: example [grey] is the effect of extracellular matrix production) or through existing boundary effects in the environment (lower part: example [grey box] is a collagen track used for contact guidance) [From 35].

