Figure 4.
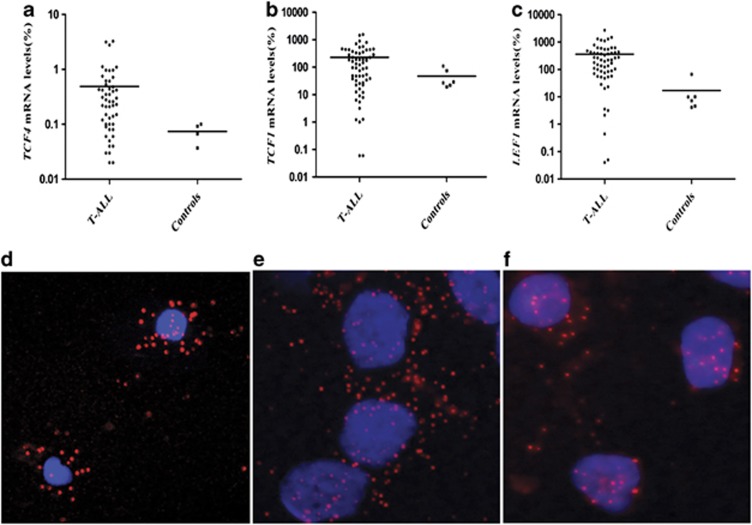
Expression of transcription factors Tcf/Lef and their interactions with β-Catenin. (a) TCF4, (b) TCF1 and (c) LEF1 relative expression levels were detected by real-time quantitative PCR (RQ-PCR) in T-ALL patients. Patients were compared with their representative thymic subsets. mRNA levels are relative to the geometric mean of three reference genes (ABL β-ACTIN and CYPA). Colocalization of β-catenin/Tcf4 was detected by in situ PLA in (d) one T-ALL patient, (e) Molt4 cell line and (f) CEM cell line. Red indicates in situ PLA signals, and blue indicates cell nuclei.

