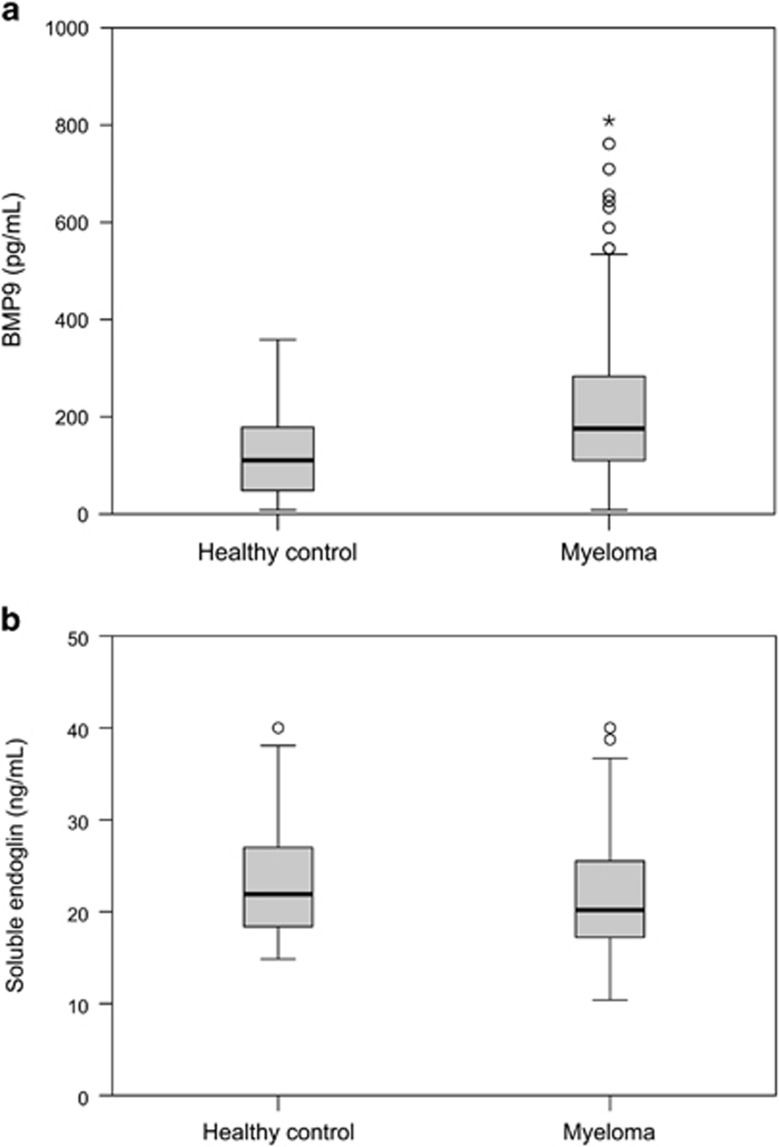
Figure 4.
Serum concentrations of BMP-9 and soluble endoglin. The concentrations of BMP-9 (a) and soluble endoglin (b) were measured in serum samples from 138 patients and 58 healthy controls. The dark lines indicate median concentrations. Outliers and extreme outliers are indicated by points and asterisks, respectively. The top of the box represents the 75th percentile, whereas the bottom represents the 25th percentile.

