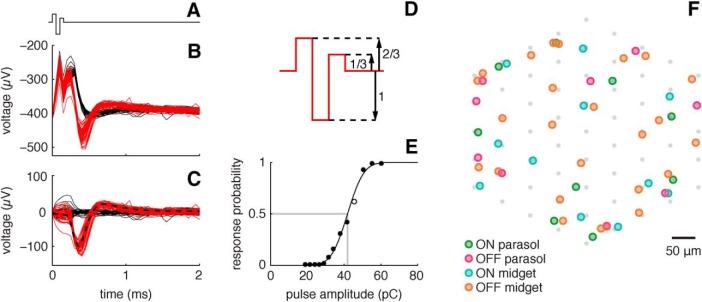
Figure 1.
Analysis of RGC responses to electrical stimulation. A, Waveform of triphasic current pulse applied through a single electrode. B, Raw voltage traces recorded from an OFF parasol cell on the stimulus electrode during and after 100 stimulation trials in which the pulse was applied. Red traces denote trials containing a spike (successes) and black traces denote trials not containing a spike (failures). C, The same data, after subtracting the average electrical artifact trace (mean of failures). Dashed black line shows the average spike waveform of the RGC recorded during visual stimulation. D, Triphasic current pulse waveform with relative phase amplitudes indicated. E, Probability of a spike as a function of pulse amplitude, and sigmoidal response curve fit. Open circle denotes stimulus amplitude applied in B and C. Activation threshold (spike probability, 0.5) is depicted with a gray line. F, Locations of cells stimulated and recorded in a single preparation. The triangulated locations of the cell bodies of stimulated cells (colored dots) are shown in relation to the array of electrodes (gray dots) used for stimulation. Different cell types are indicated by different colors.

