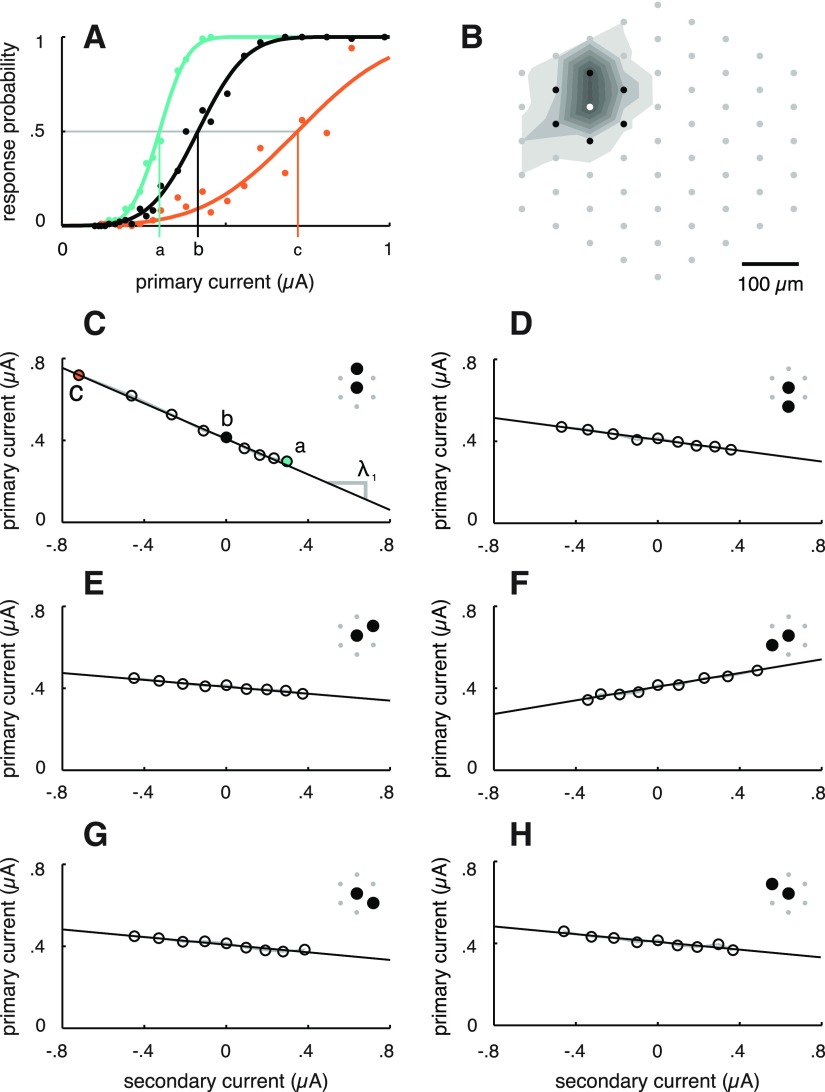
Figure 2.
Linearity of current tradeoff for simultaneous current injection through pairs of electrodes. A, Response curves for an OFF parasol cell (same cell as in Fig. 1B,C,E) resulting from cathodal current pulses injected through the primary electrode alone (black), from equal amplitude cathodal pulses passed simultaneously through one secondary electrode (teal) and from equal amplitude anodal pulses passed through the same secondary electrode (orange). Vertical lines show activation threshold for each case. B, Layout of primary (white dot) and secondary (black dots) electrodes relative to the EI of the targeted RGC (shaded contours; see Materials and Methods). C, Measured activation thresholds corresponding to the response curves depicted in A, along with other tested current ratios for the same electrode pair (inset, black). The gray region indicates SDs of threshold estimates based on bootstrap analysis (see Materials and Methods); the width of the region is significantly smaller than the open circles. The black line depicts the linear model fit to the thresholds. Slope of the linear fit is equal to the negative of the coefficient associated with the secondary electrode (Eq. 3, λ1). Negative secondary current values signify anodal current pulses. D–H, Measured thresholds and linear model fits for the other five electrode pairs, shown in the inset (black).

