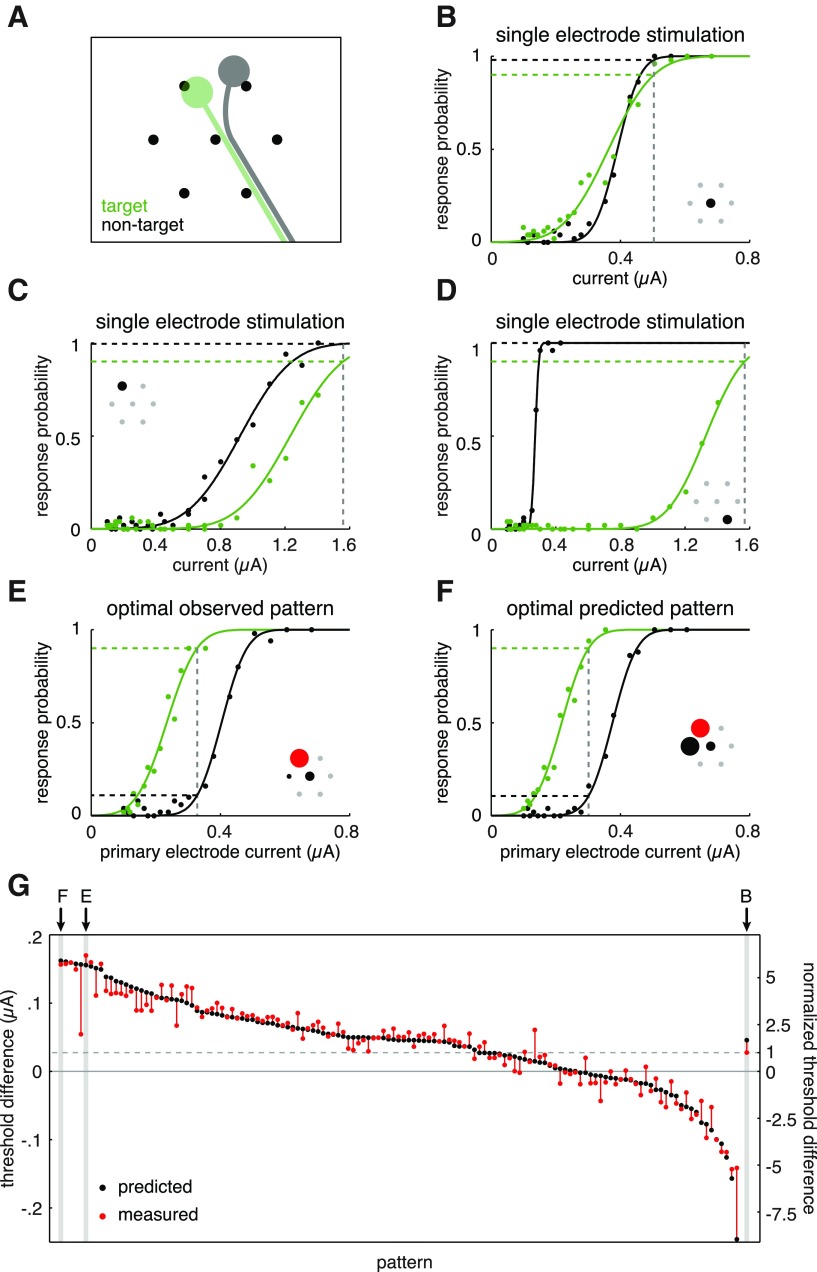
Figure 6.
Activation of a target RGC (OFF parasol), without activation of a nontarget RGC (ON parasol), was not possible using single-electrode stimulation but was possible using a stimulus pattern predicted by the linear model. A, Illustration of inferred soma and axon positions of target (green) and nontarget (gray) RGCs, based on the electrical image of each cell (see Materials and Methods), relative to the set of seven electrodes used in stimulation patterns. B–D, Response curves for the target cell (green) and nontarget cell (black) when stimulated with each of the individual electrodes (inset) capable of eliciting a spike in the target cell. Dashed gray lines indicate the current amplitude required to activate the target cell with 0.9 probability, based on response curves. E, Response curves of the target and nontarget cells for the stimulation pattern that resulted in the maximum observed selectivity for the target RGC. Selectivity was defined as the difference between the target and nontarget cell thresholds. Inset shows stimulus pattern, with circle diameters proportional to pulse amplitudes and colors indicating pulse polarity (cathodal in black, anodal in red). F, Responses to stimulation with the pattern that was predicted to be maximally selective by the linear model. G, Predicted (black) and measured (red) threshold differences for all tested stimulus patterns, ordered by predicted selectivity. Vertical axes indicate threshold difference in terms of primary electrode pulse amplitude (left), and normalized to the observed threshold difference of the most selective single electrode (right). B, Threshold difference corresponding to stimulation with the most selective single electrode is shown for comparison at right.

