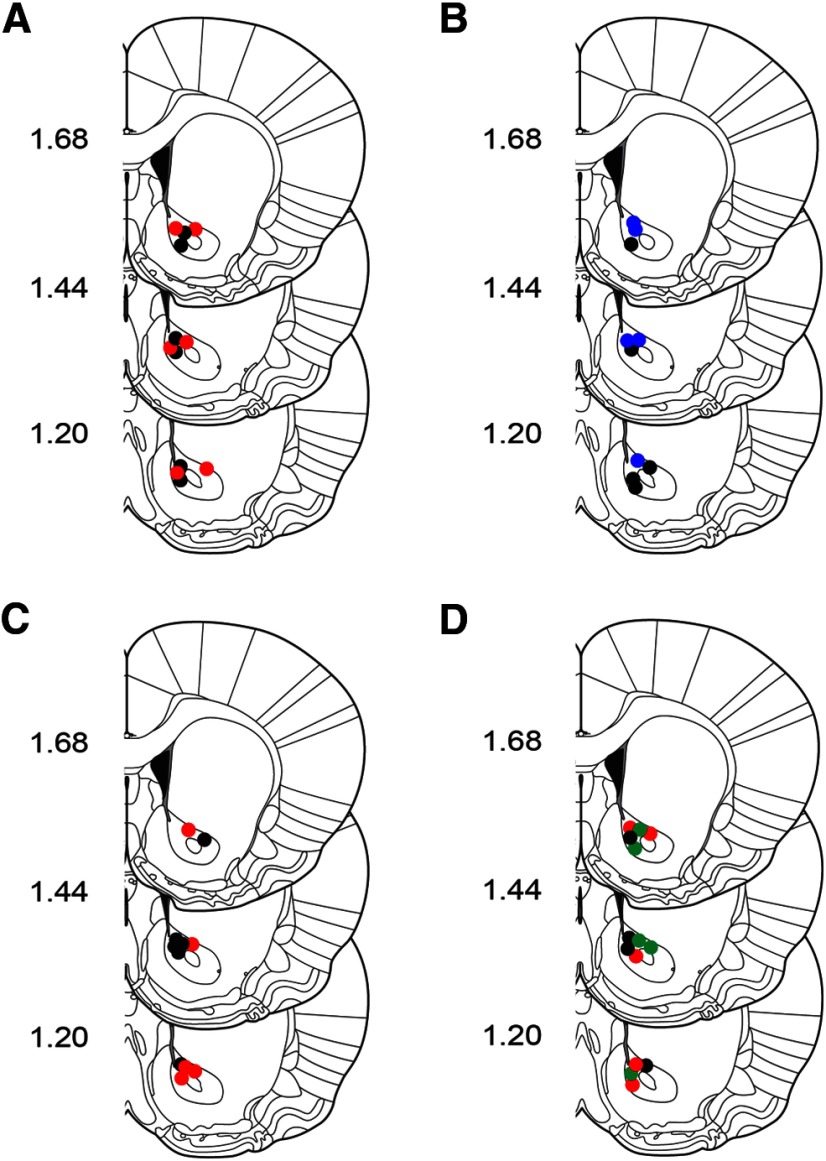
Figure 1.
Summary of NAc recording sites. Coronal brain sections modified from Paxinos and Watson (2007). Colored circles indicate approximate recording locations. Numbers at left indicate approximate distance from bregma. A, Recording locations from ad libitum fed rats that received LV saline (n = 6) or ghrelin (n = 6). B, Recording locations from food-restricted rats that received LV saline (n = 5) or d-[Lys]-GHRP (n = 5). C, Recording locations from ad libitum fed rats that received LH aCSF (n = 6) or ghrelin (n = 5). D, Recording locations from ad libitum fed rats that received intra-VTA aCSF (n = 4), ghrelin (n = 5), or orexin-A (n = 5). Black, vehicle (saline or aCSF); red, ghrelin; blue, d-[Lys]-GHRP; green, orexin-A.

