Figure 2.
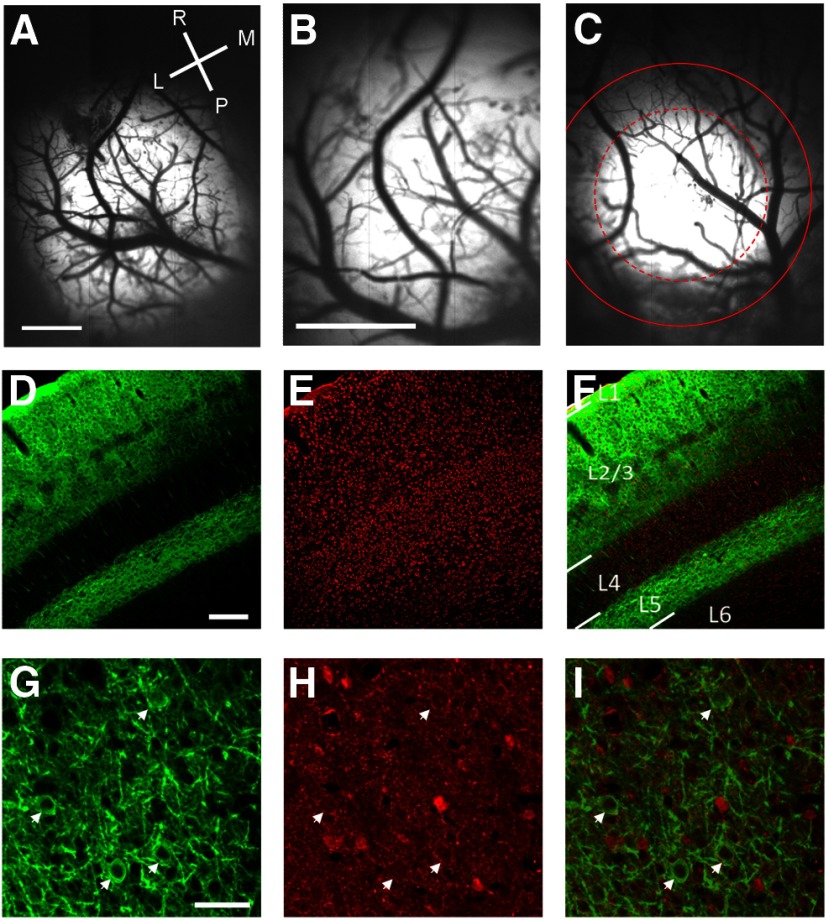
Demonstration of ChR2-YFP expression patterns in V1. A, Example from a case with a very large expression area. Image of YFP expression in vivo obtained with the CCD camera through a 4× objective; lighter areas of the image indicate areas with strong ChR2-YFP expression. Scale bar, 1 mm. L, lateral; M, medial; R, rostral; P, posterior. B, Imaging of YFP expression of the same case as shown in A with the 10× objective typically used for our optical imaging and optogenetic experiments. With this objective the fluorescence appears to fill the entire imaging window. Scale bars: B, C, 1 mm. C, Imaging of YFP from a second case with a more moderate expression area. The dashed red circle indicates the FWHH of the best-fit 2 d Gaussian. The solid red line indicates the full-width at 20% of maximum fluorescence. D, Coronal section of V1 stained for YFP. Staining for cell bodies is strong in the superficial layers and layer 5 and is absent in layer 4. Scale bars: D–F, 200 μm. E, Nissl staining of the same coronal section as shown in D. F, Overlay of the Nissl staining (red) and YFP staining (green). L1, layer 1; L2/3, layer 2/3; L4, layer 4; L5, layer 5; L6, layer 6. G, Tangential section of V1 stained for YFP imaged at high magnification showing the fine pattern of staining within layer 2/3. White arrows show neurons labeled with ChR2. Scale bars: G–I, 50 μm. H, GABA staining of the same section as shown in G; white arrows show that the same neurons in G are negative with GABA staining. I, Overlay of YFP staining (green) and GABA staining (red).

