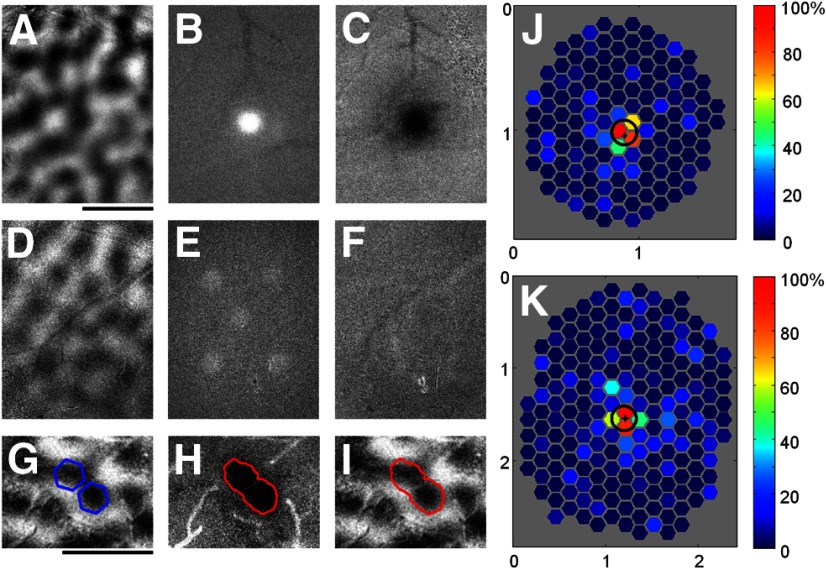
Figure 3.
Focal pattern of cortical activity obtained with blue light stimulation demonstrated by intrinsic signal imaging and extracellular recording. A–C, Optical imaging data from a case with ChR2 expression using a blue light stimulus consisting of a single hexagon (edge to edge diameter = 250 μm). A, Orientation difference image. B, Average intrinsic signal response from the 2 s (4 frames) of optical imaging data acquisition while the blue light stimulus was still on. The white area of the image is the direct result of the added blue light during this portion of the trial. C, Average intrinsic signal response from the last 2.5 s (5 frames) of the same trials. The black area indicates the region of cortex that responded strongly to the blue light stimulus. D–F, Optical imaging data from a control case with no ChR2 expression, using a blue light stimulus consisting of five hexagons (diameter = 250 μm). D, Orientation difference map. E, Average intrinsic signal response during the 2 s of blue light stimulation. As in B, the white areas indicate regions where the blue light is being displayed during these frames. F, Average intrinsic signal response during the last 2.5 s (5 frames) of the same trials. There are no dark regions visible, indicating that there was no cortical response to blue light in this control animal. G, Orientation difference map and two sites selected for optogenetic activation with the same orientation preference (blue hexagons). H, Population activity measured in response to activation of the sites shown in G. Red line corresponds to the 50% activation contour. I, The 50% activation contour (red) now placed over the orientation difference image to show focal activation of the selected orientation preference domain. J, K, Electrophysiological recordings used to obtain spatial mapping of cortical areas that provide input to individual recording sites in V1. J, Hexagonal grid showing the response map obtained from a single example case. Each hexagon is centered on one of the sampled cortical locations, and the color of the hexagon shows the average normalized response to blue light presented at that location. Actual hexagons used on each trial were twice as large as those shown in the figure. Strong areas of response are found only within a short range of the electrode (“+” symbol). Black circle indicates the FWHH (199 μm) obtained by fitting a 2D Gaussian curve to the response map. K, The response map and FWHH (266 μm) obtained from a second example case. Scale bars: A, G, 1 mm. Axes labels in J and K are in millimeters.

