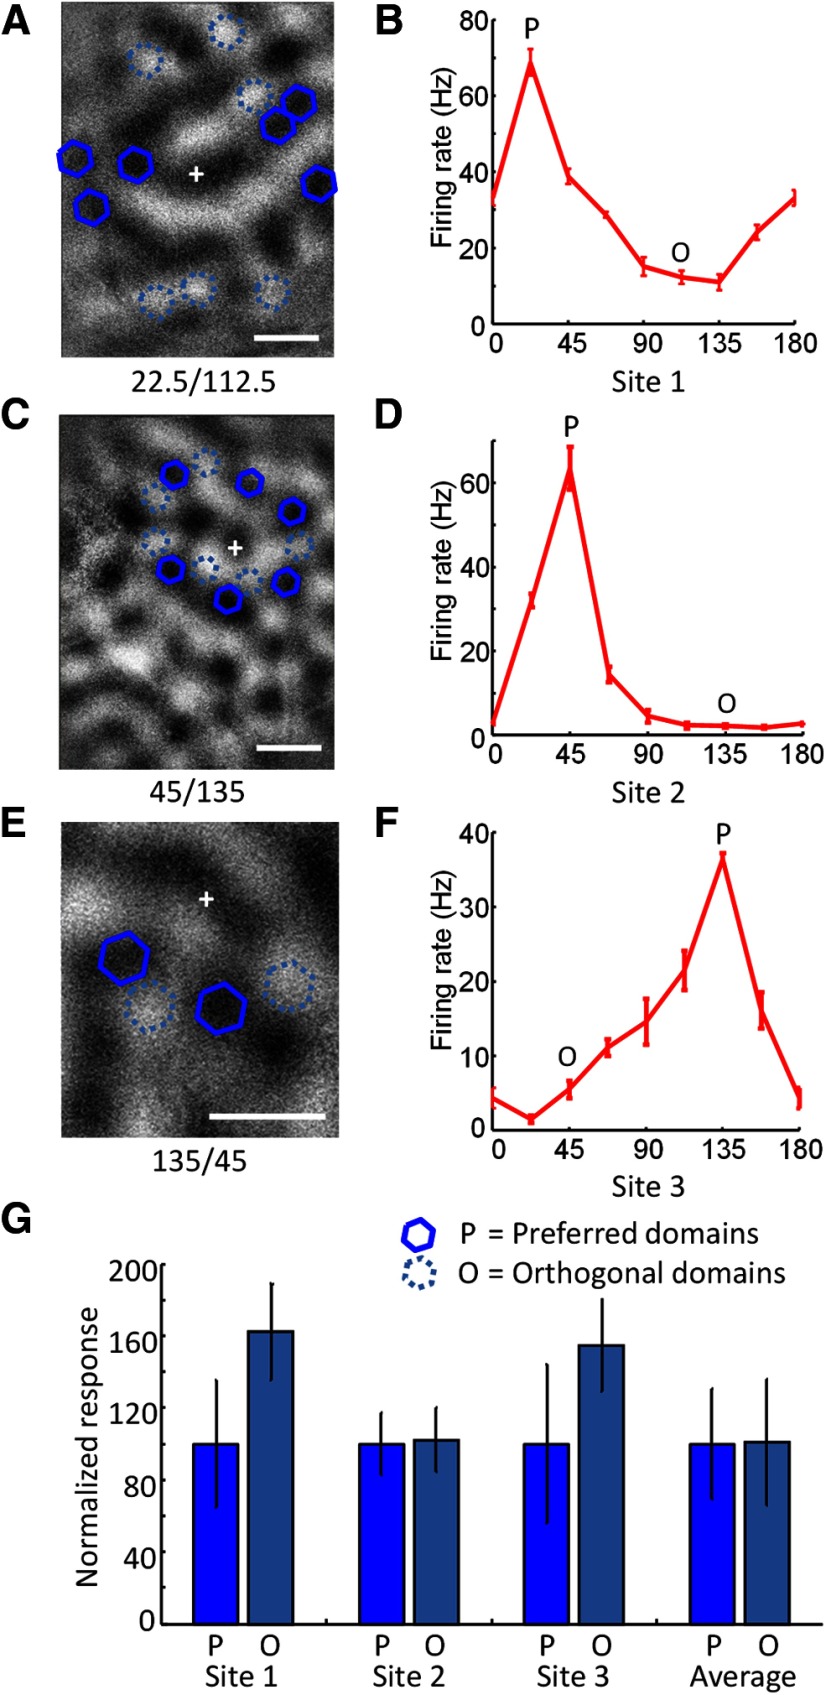
Figure 6.
Domain specificity of blue light effects. A, Spatial layout of testing of orientation domain specificity in one case. An orientation difference image is shown with the recording site (+), optogenetic stimulation sites that were centered over orientation domains with the same orientation preference (blue solid hexagons) as the recording site, and stimulation sites that were centered over domains with the orthogonal preference (light blue dashed hexagons). B, Orientation tuning curve from the recording site shown in A obtained with presentation of visual stimuli of various orientation. Error bars indicate SEM. The preferred orientation is indicated with the letter P, and the orthogonal orientation with the letter O. C, Spatial layout for testing of domain specificity in a second case. D, Orientation tuning curve for the case shown in C. E, Spatial layout for testing of domain specificity in a third case. F, Orientation tuning for the case shown in E. G, Responses to optogenetic stimulation of preferred domains (dark blue) and orthogonal domains (light blue) in the three example cases shown in A–F, and the average responses to stimulation of preferred or orthogonal domains across all cases examined (n = 10). Scale bars: A, C, E, 500 μm.

