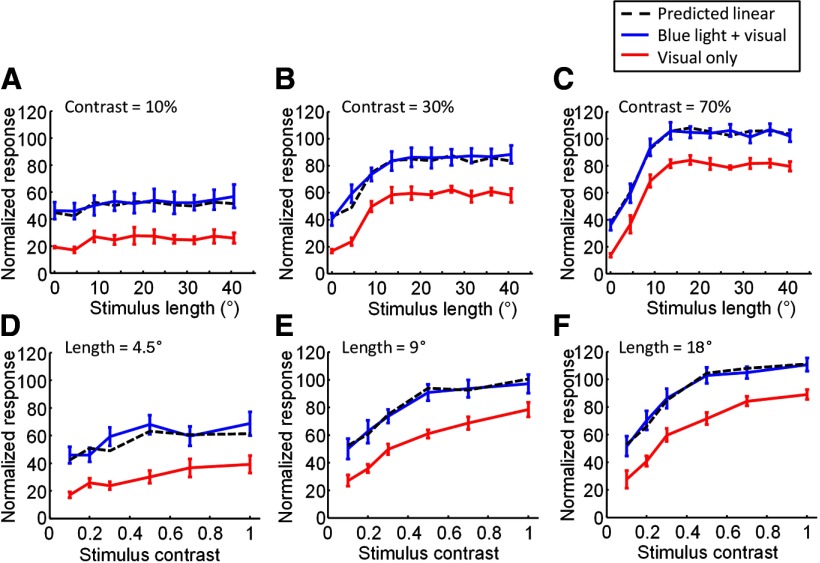
Figure 8.
Summary for interaction between blue light stimulation and visual stimulation when parameters of the visual stimulus are varied. A–C, Average effects of blue light stimulation on length tuning properties for the full set of multi-unit recording sites examined (n = 8). A, Average length tuning obtained with (blue line) and without (red line) blue light stimulation. Dashed black line indicates the predicted responses to combined visual and optogenetic stimulation if responses added linearly. Visual contrast = 10%. B, Same as in A but for visual stimulus contrast = 30%. C, Same as in A and B but for visual stimulus contrast = 70%. D–F, Average effects of blue stimulation on the contrast tuning properties of the full set of recording sites examined (n = 8). D, Average contrast tuning curve either with (blue line) or without (red line) simultaneous blue light stimulation. Dashed black line again indicates prediction if responses added linearly. Visual stimuli were 4.5° in length. E, As in D, but for visual stimuli that were 9° in length. F, As in D and E, but for visual stimuli that were 18° in length.

