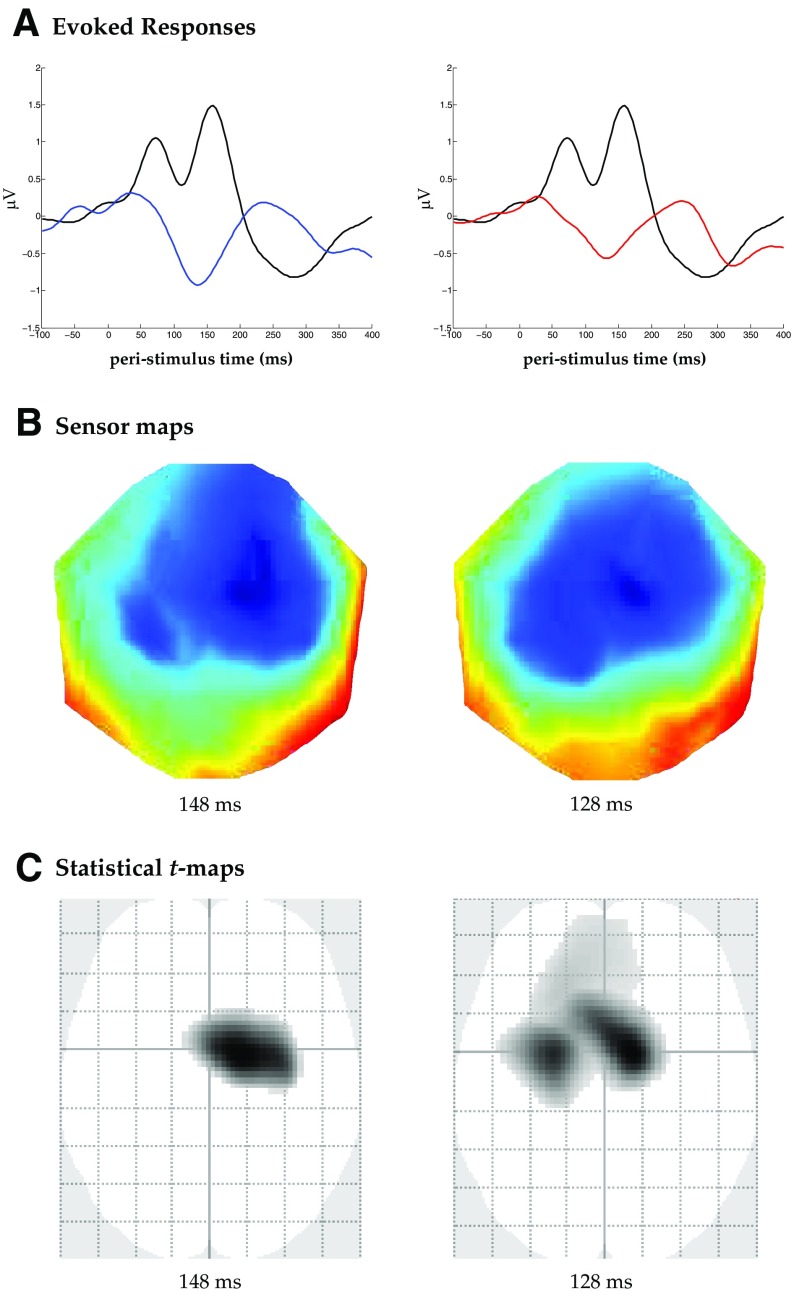
Figure 2.
A, ERPs to left (blue), right (red), and midline (black) stimuli at the EEG sensor with maximal statistical effect. B, ERP scalp maps at the time of the maximal peak for left (148 ms) and right (128 ms) spatial deviancy, respectively. C, Statistical t maps showing the effect of left spatial deviancy (left) and right spatial deviancy (right), thresholded at p < 0.001 uncorrected for visualization.

